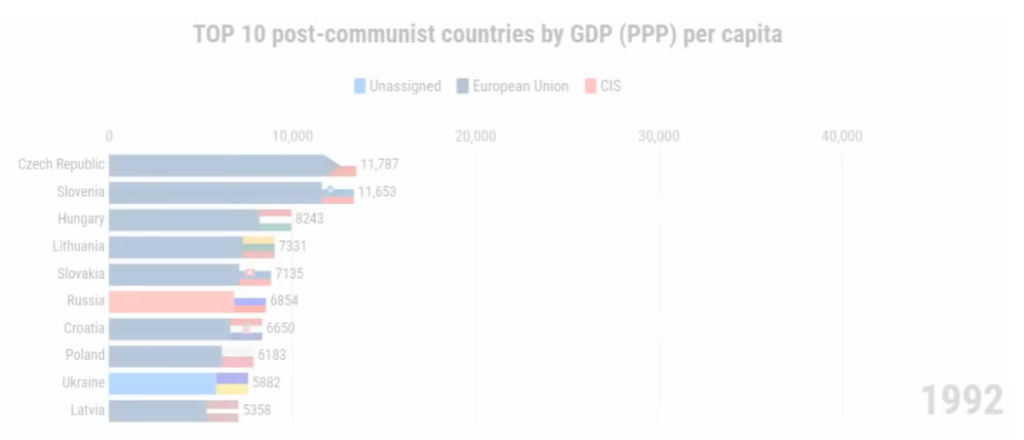
December 10, 2019 – How have the economies of Eastern and Central Europe been growing since the collapse of Communism? An interesting GDP per capita comparison year by year from 1992 to 2017.
The fall of the Berlin wall and all that followed brought immense change to Eastern and Central Europe, with some countries adapting better than others, some affected by war, others embracing the digital age. A very interesting video timeline of how those economies have fared from 1992 to 2007 was covered by Index today in this great video below.
Another way to look at the data, in much slower time, is year by year, chart by chart, to see how Croatia has fared with neighbouring countries in terms of GDP per capita from 1992 to 2017. No need for words or commentary from me – information about the data from Lionwork Statistics is at the bottom of the article.
About the data (from Lionwork Statistics YouTube post):
Which post-communist economy performed the best during the last 25 years? What statistical data tells us about the journey of these young democracies. Let’s see and discuss.
CAUTION:
1. There were no data available for Slovenia, Croatia, Latvia, Lithuania, and Estonia until 1995. In these cases, the average growth rate of the nearest region was used to calculate the estimated value. In the case of Estonia, data are shown from 1993, since no similar region is present due to geographical placement.
2. The comparison includes Albania, North Macedonia, Montenegro, Serbia, Bosnia and Herzegovina Slovenia, Lithuania, Latvia, Estonia, Hungary, Slovakia, Czech Republic, Poland, Croatia, Bulgaria, Romania, Moldova, Belarus, Russia, and Ukraine. Some never made it to the Top 10 during the time period.
3. GDP (PPP) is a measure which consists of crude income compared to prices of goods in countries or regions. Value widely represents the economic position of individuals and is usually considered as a pretty accurate statistic. Numbers may vary from one source to another based on a methodical approach to the collection of data.
4. Numbers present are the average of all individuals including children, students, unemployed and retired expressed in international USD value to date (19.04.2019).


