It has been exactly one month since Russia has invaded Ukraine. Nobody knows how much more the war is going to last and we can only hope it will end soon. This is certainly one of the biggest humanitarian crises the European continent has seen in a long time. The West reacted rather promptly to the Russian invasion by imposing severe economic sanctions on the Russian Federation in an effort to persuade Russian leadership to stop the war.
Since the invasion has started, the European Union has adopted four packages of economic sanctions. Even though these sanctions still do not include all parts of the Russian economy, consumers and corporations are often choosing not to do business with Russia and Russian companies on their own initiative. I will provide an overview of the Croatian foreign trade of goods with Russia and Ukraine which will give us a better approximation of the Croatian position in these extreme circumstances.
EXPORTS
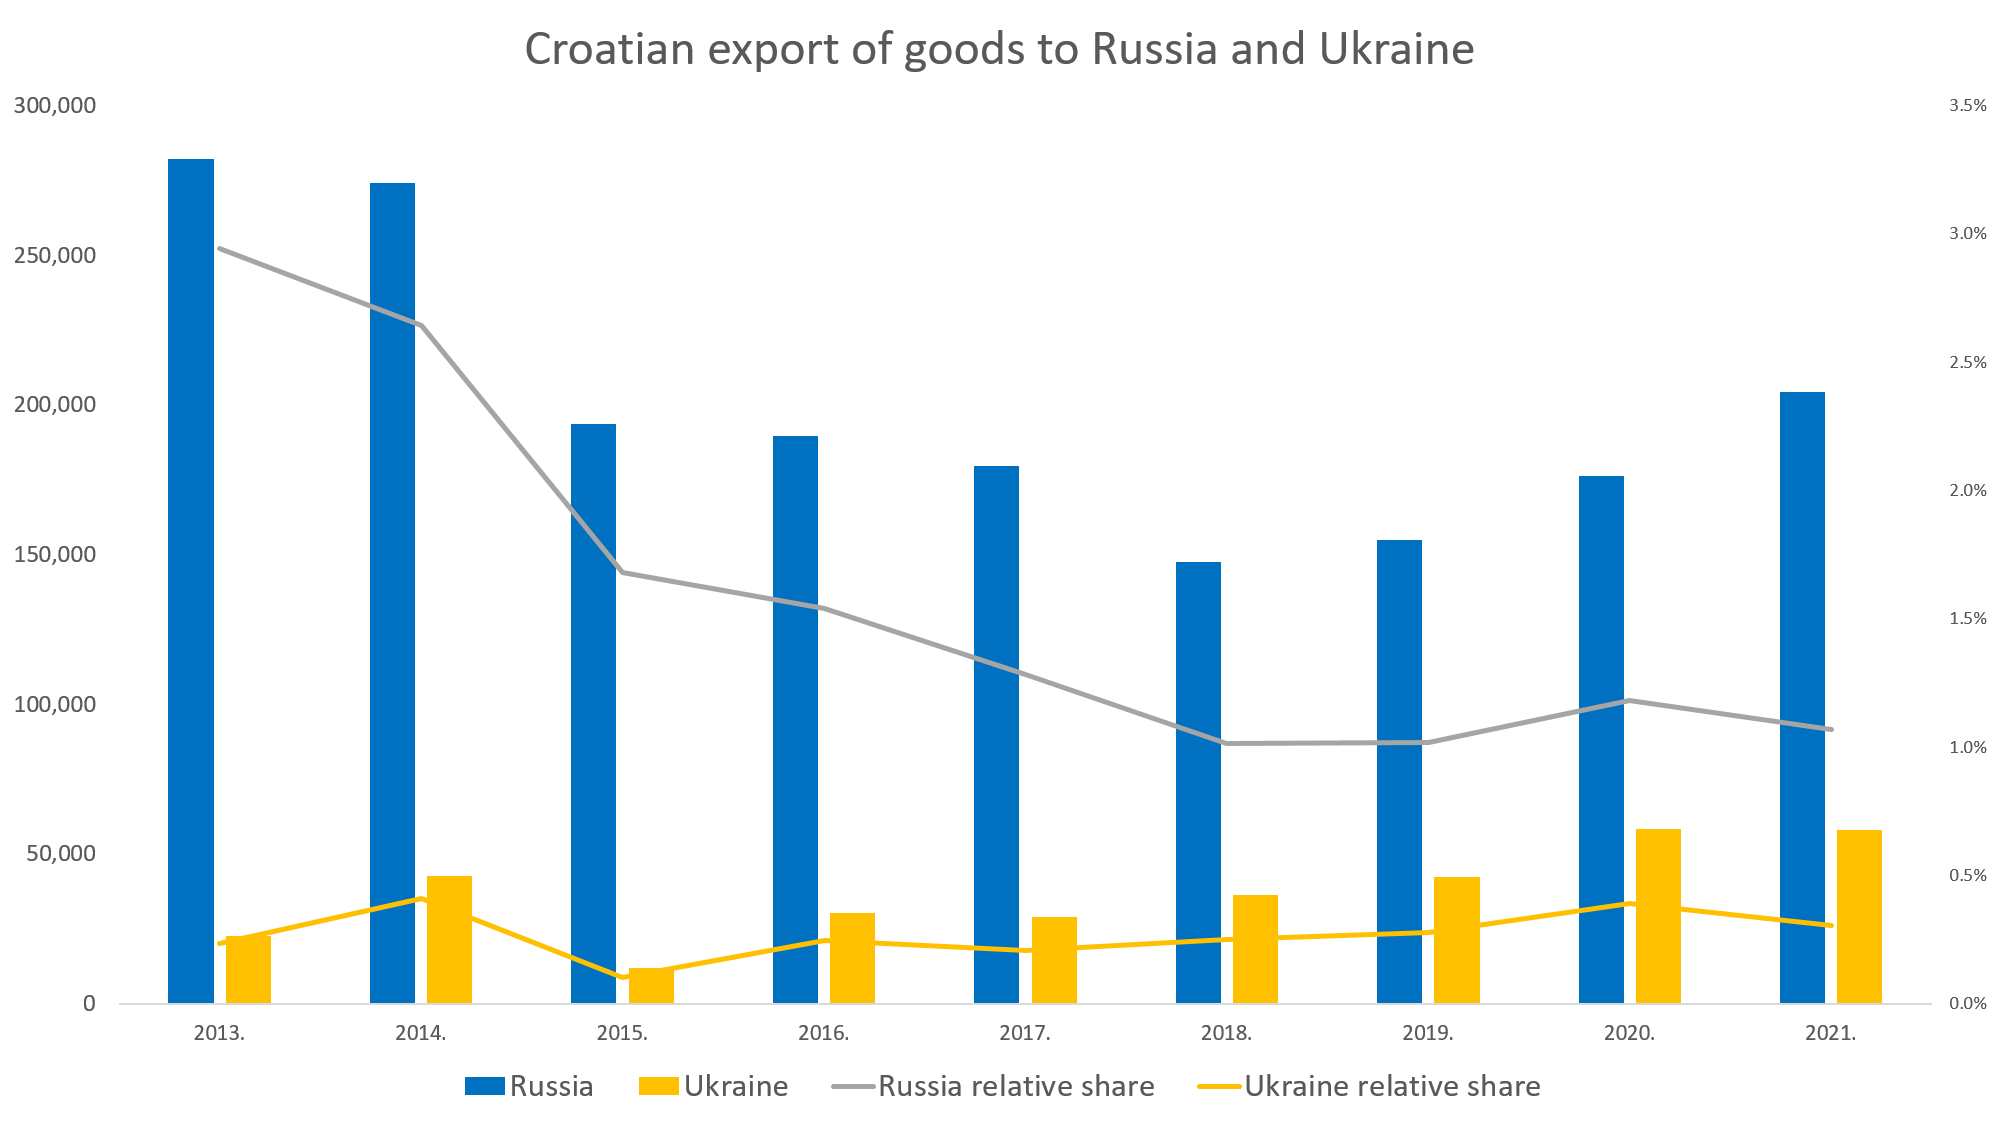
In 2021 Croatia exported 204 million Euros of goods to Russia which represents 1.1% of the total Croatian export of goods. In the last few years, Croatian export of goods to Russia has been on the rise, but they are still 28% lower than the level in 2013. In the same period, the relative share of exports to Russia has fallen from 2.9% to 1.1%.
On the other hand, Croatia has exported 58 million Euros worth of goods to Ukraine in 2021 which represents 0.3% of the total Croatian export of goods. In the observed period exports to Ukraine have been rising in absolute terms by 157% beating the total exports growth of 99%. In relative terms exports to Ukraine were fluctuating between 0.1% and 0.4%.
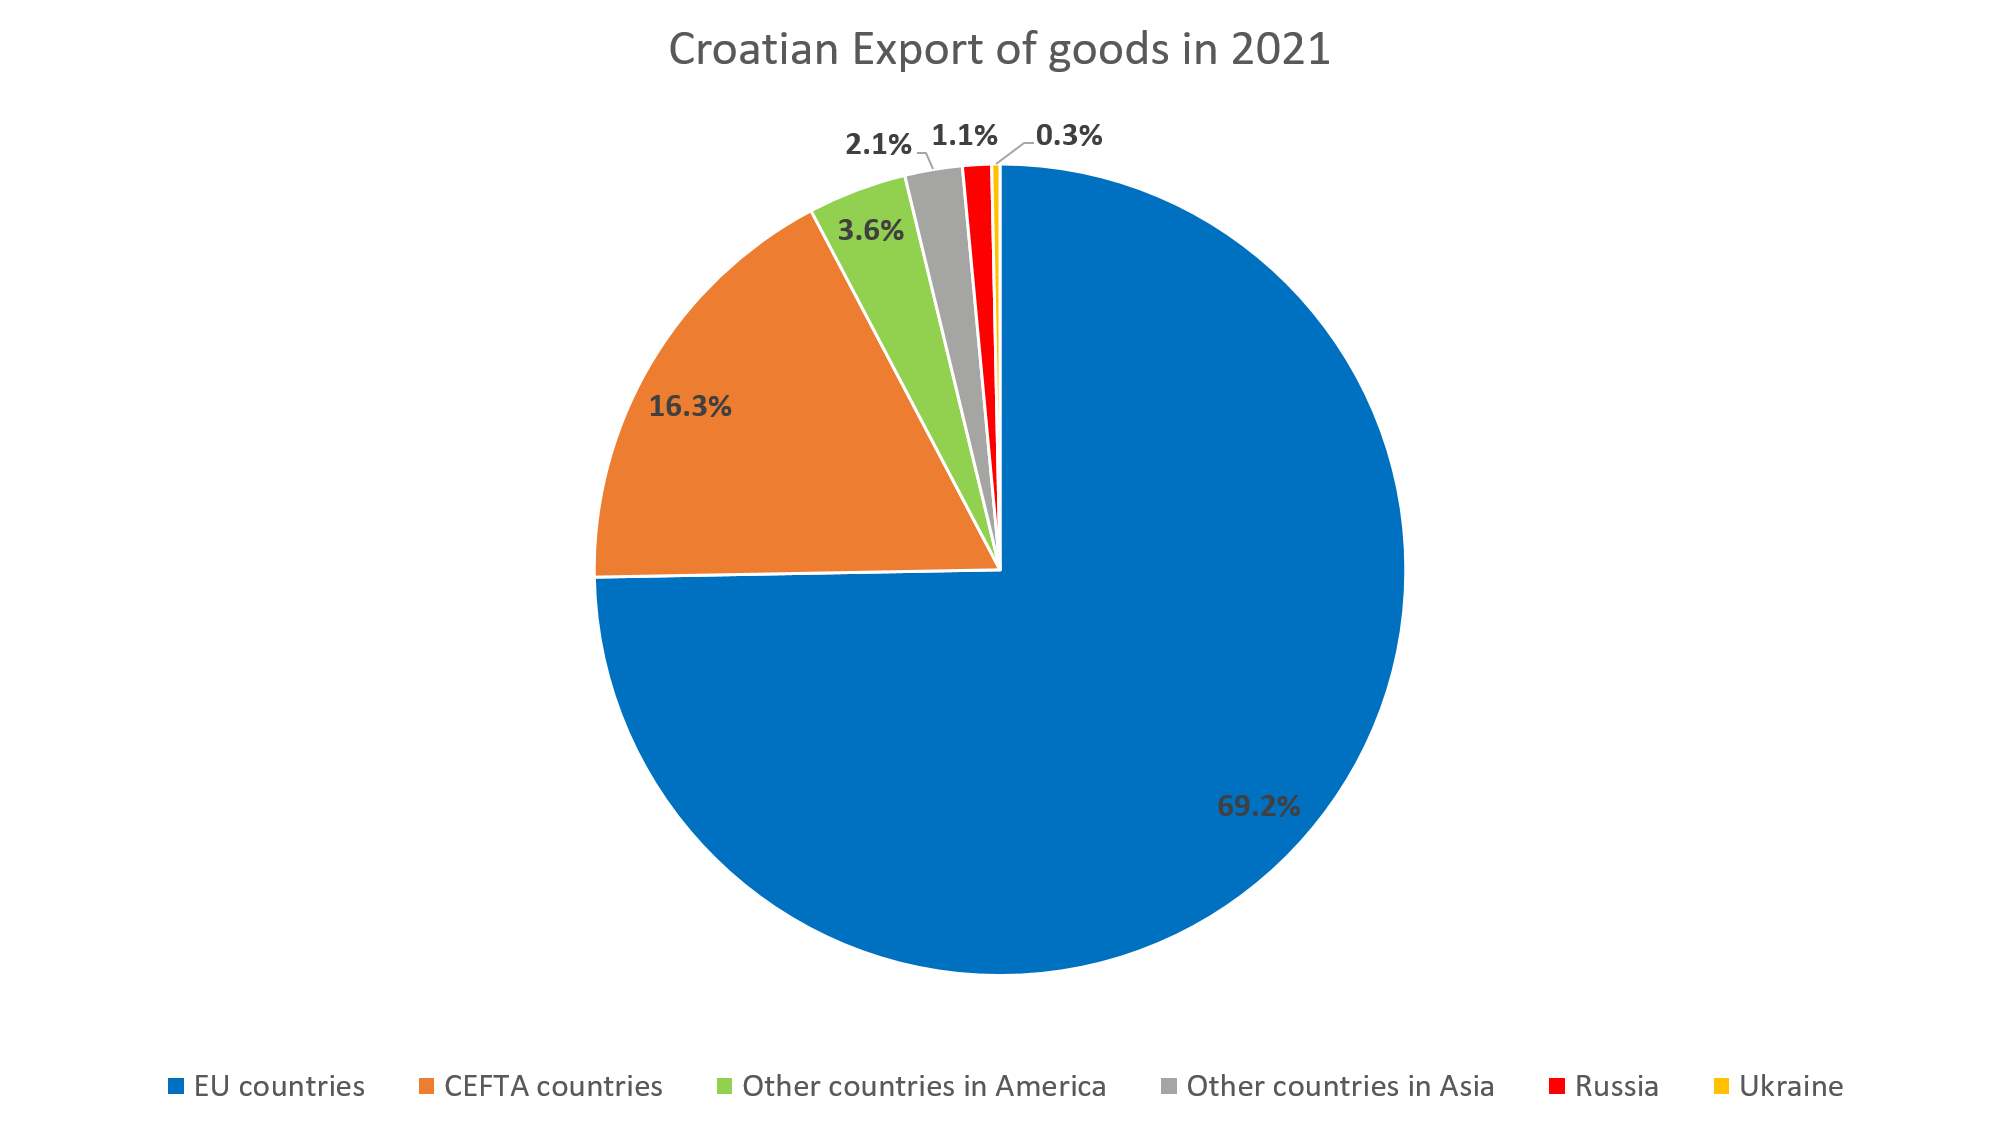
When comparing exports to Russia and Ukraine to other markets we can see that their relative importance in terms of total Croatian exports is very small. The biggest Croatian trade partner is the European Union with 69.2% of exports, followed by CEFTA countries and other countries in America with 16.3% and 3.6% respectively. What is more Russian market does not come even close to the top ten exporting countries and is far behind the Croatian traditional trade partners such as Slovenia with 13%, Italy 12%, Germany 12%, and Hungary and Bosnia and Herzegovina both with 9%.
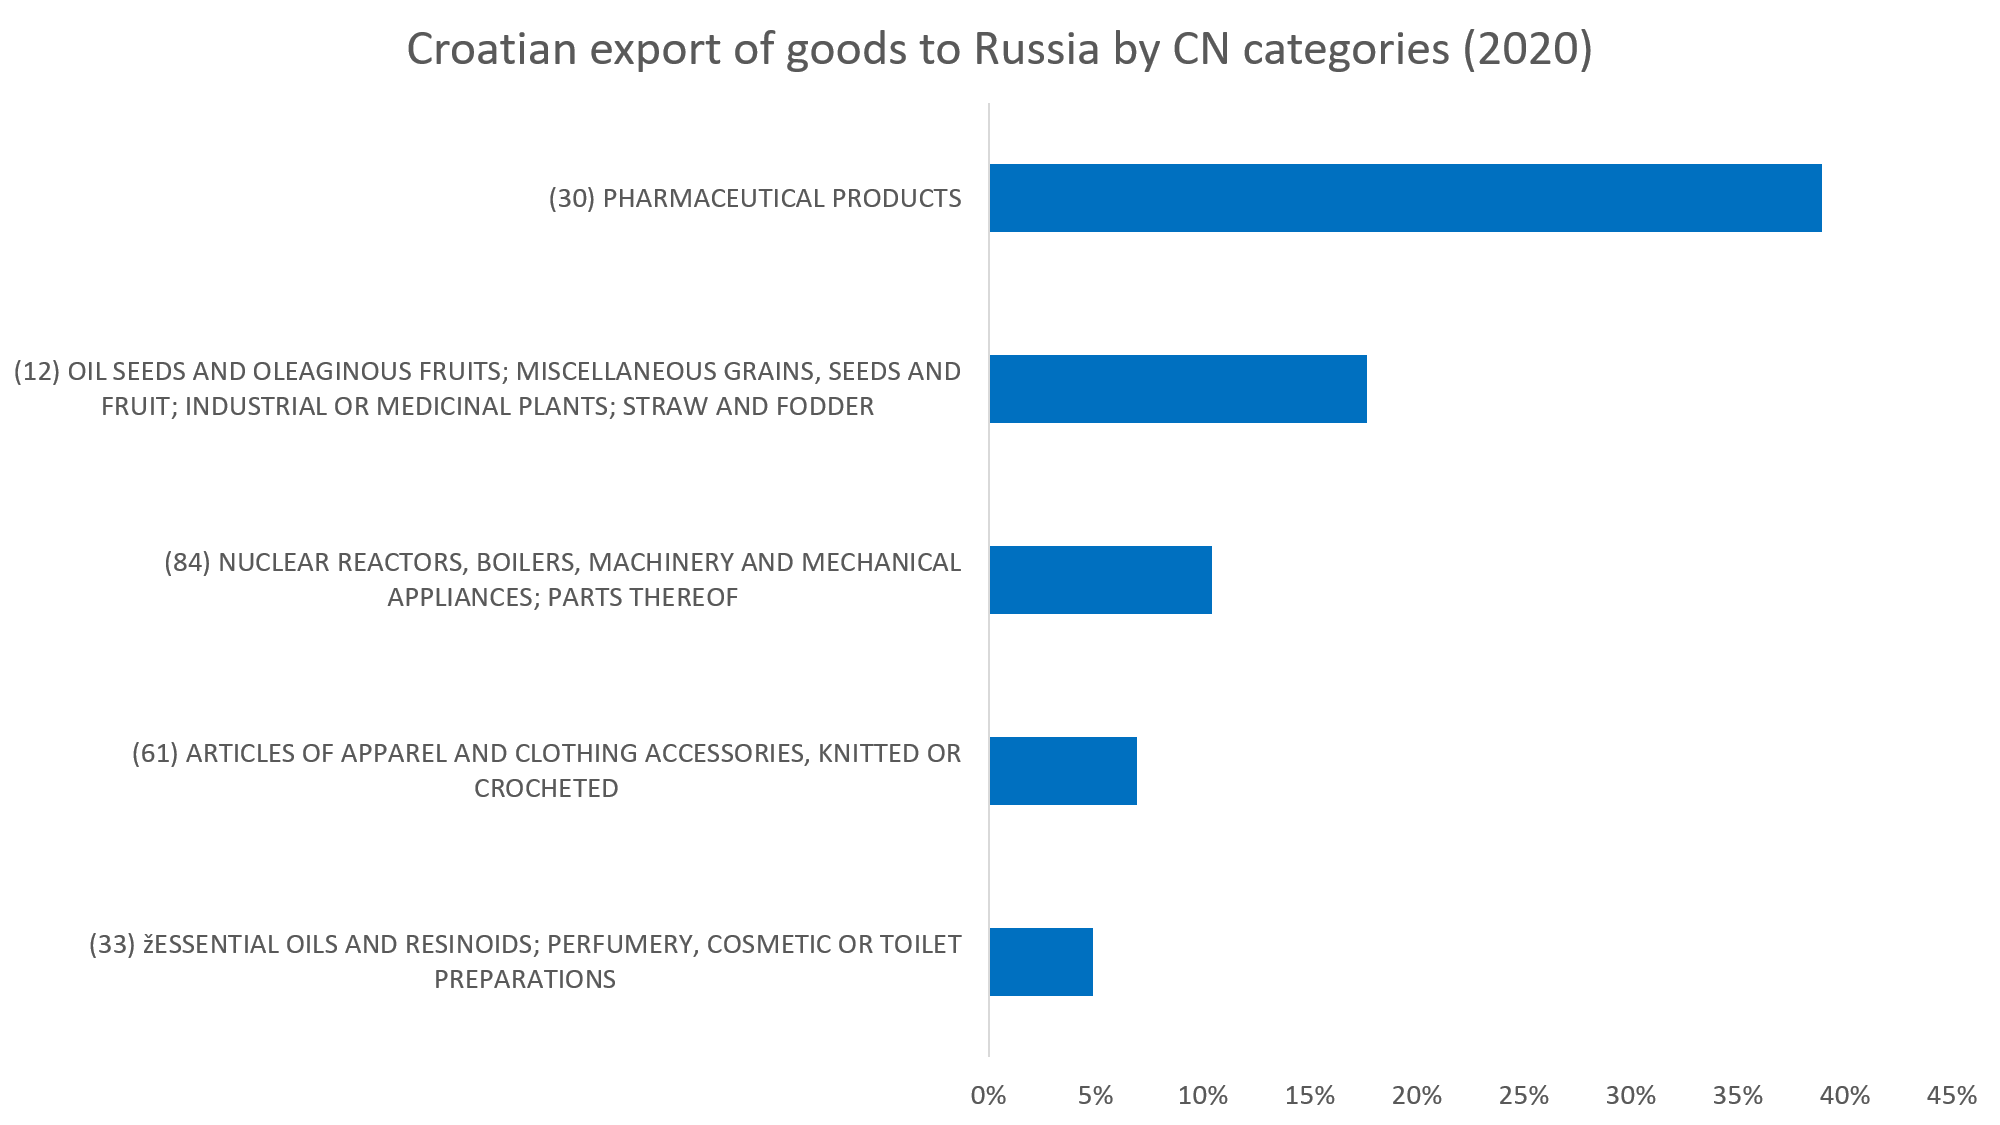
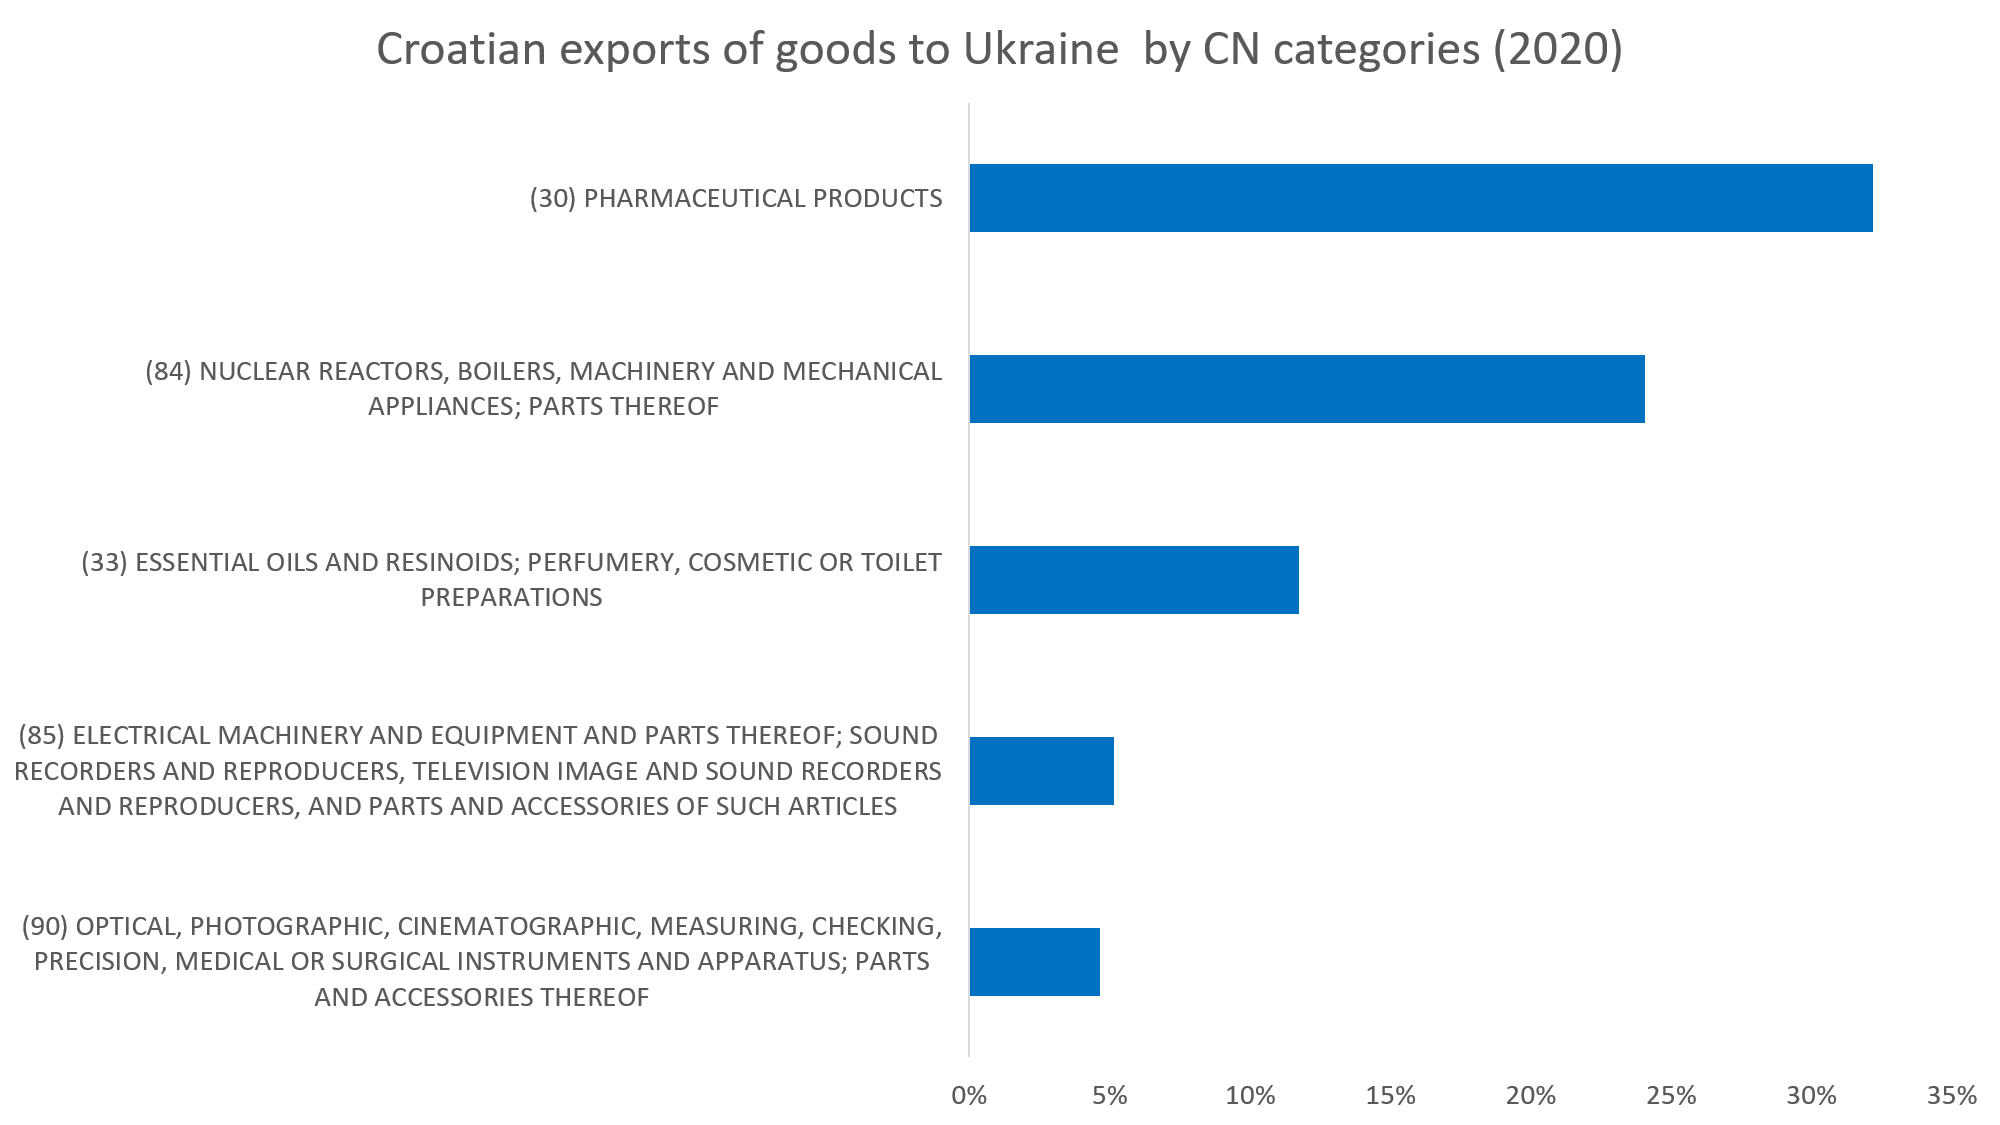
In order to dig deeper into the structure of the Croatian exports of goods to Russia and Ukraine, I have used the official Combined Nomenclature (CN) from the European Union. The breakdown of the exports by the CN is provided by the DZS and the provided data is from 2020. In the case of both Russia and Ukraine, we can see that pharmaceutical products hold the largest share of exports with 39% and 32,2% respectively. The combined export of pharmaceutical products to Russia and Ukraine account for 8.62% of total Croatian export of the same category of products. Additionally, categories (85) and (12) can be found in both Russian and Ukrainian top 5 export categories and they make up 0.64% and 17.32% of the Croatian exports in those categories, respectively.
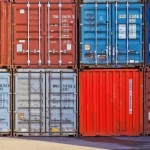
IMPORTS
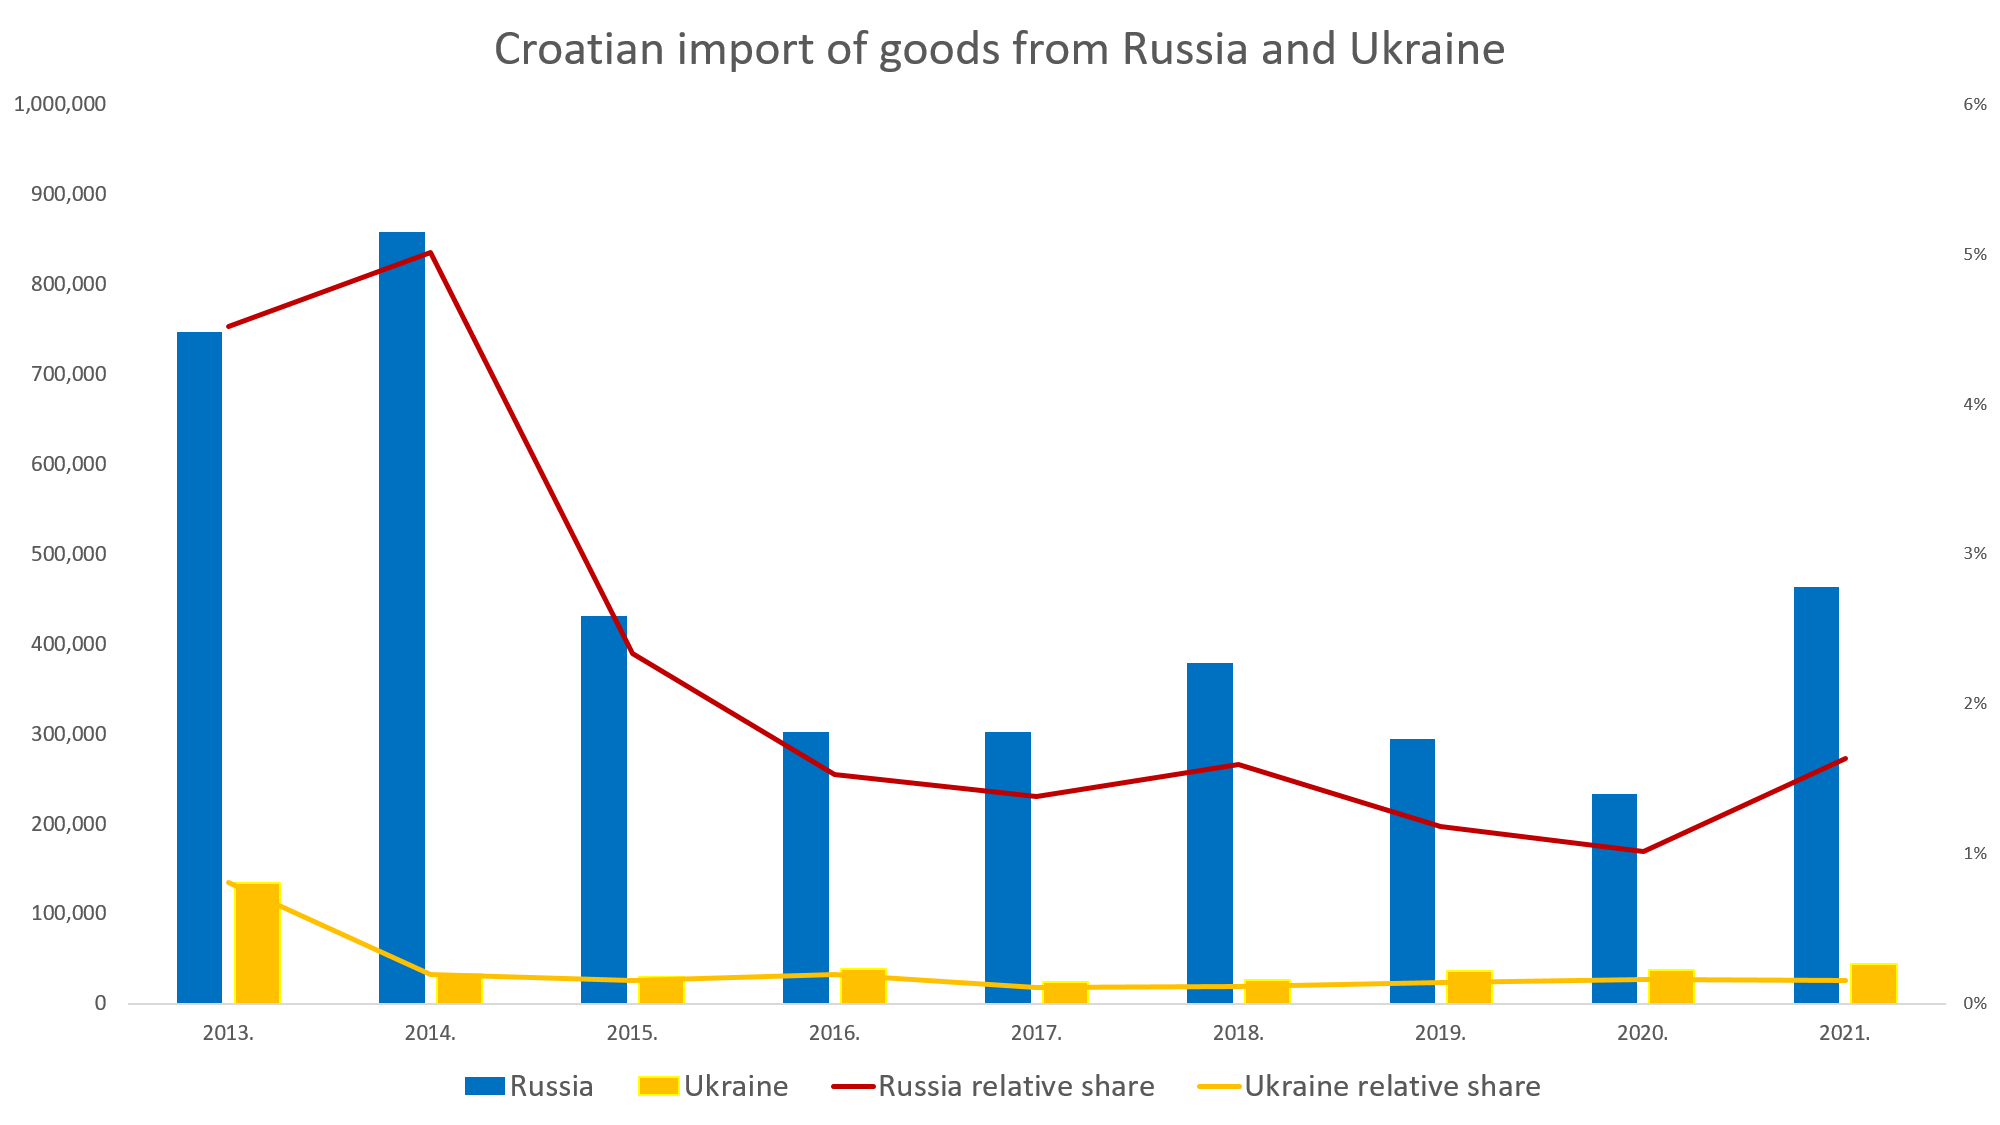
Croatian imports from Russia have amounted to 463 million Euros worth of goods in 2021, which was a rise of almost 100% compared to 2020. Despite the steep rise imports from Russia are still lower by 38% compared to 2013. The relative share of Russian imports in the total Croatian imports has fallen from 4,5% in 2013 to 1,6% in 2021.
In 2021 Croatia has imported 44 million Euros worth of goods from Ukraine which is a drop of 67% from the peak in 2013. The relative share of Ukrainian imports also fell in 2014 and is around 0.2% since then.
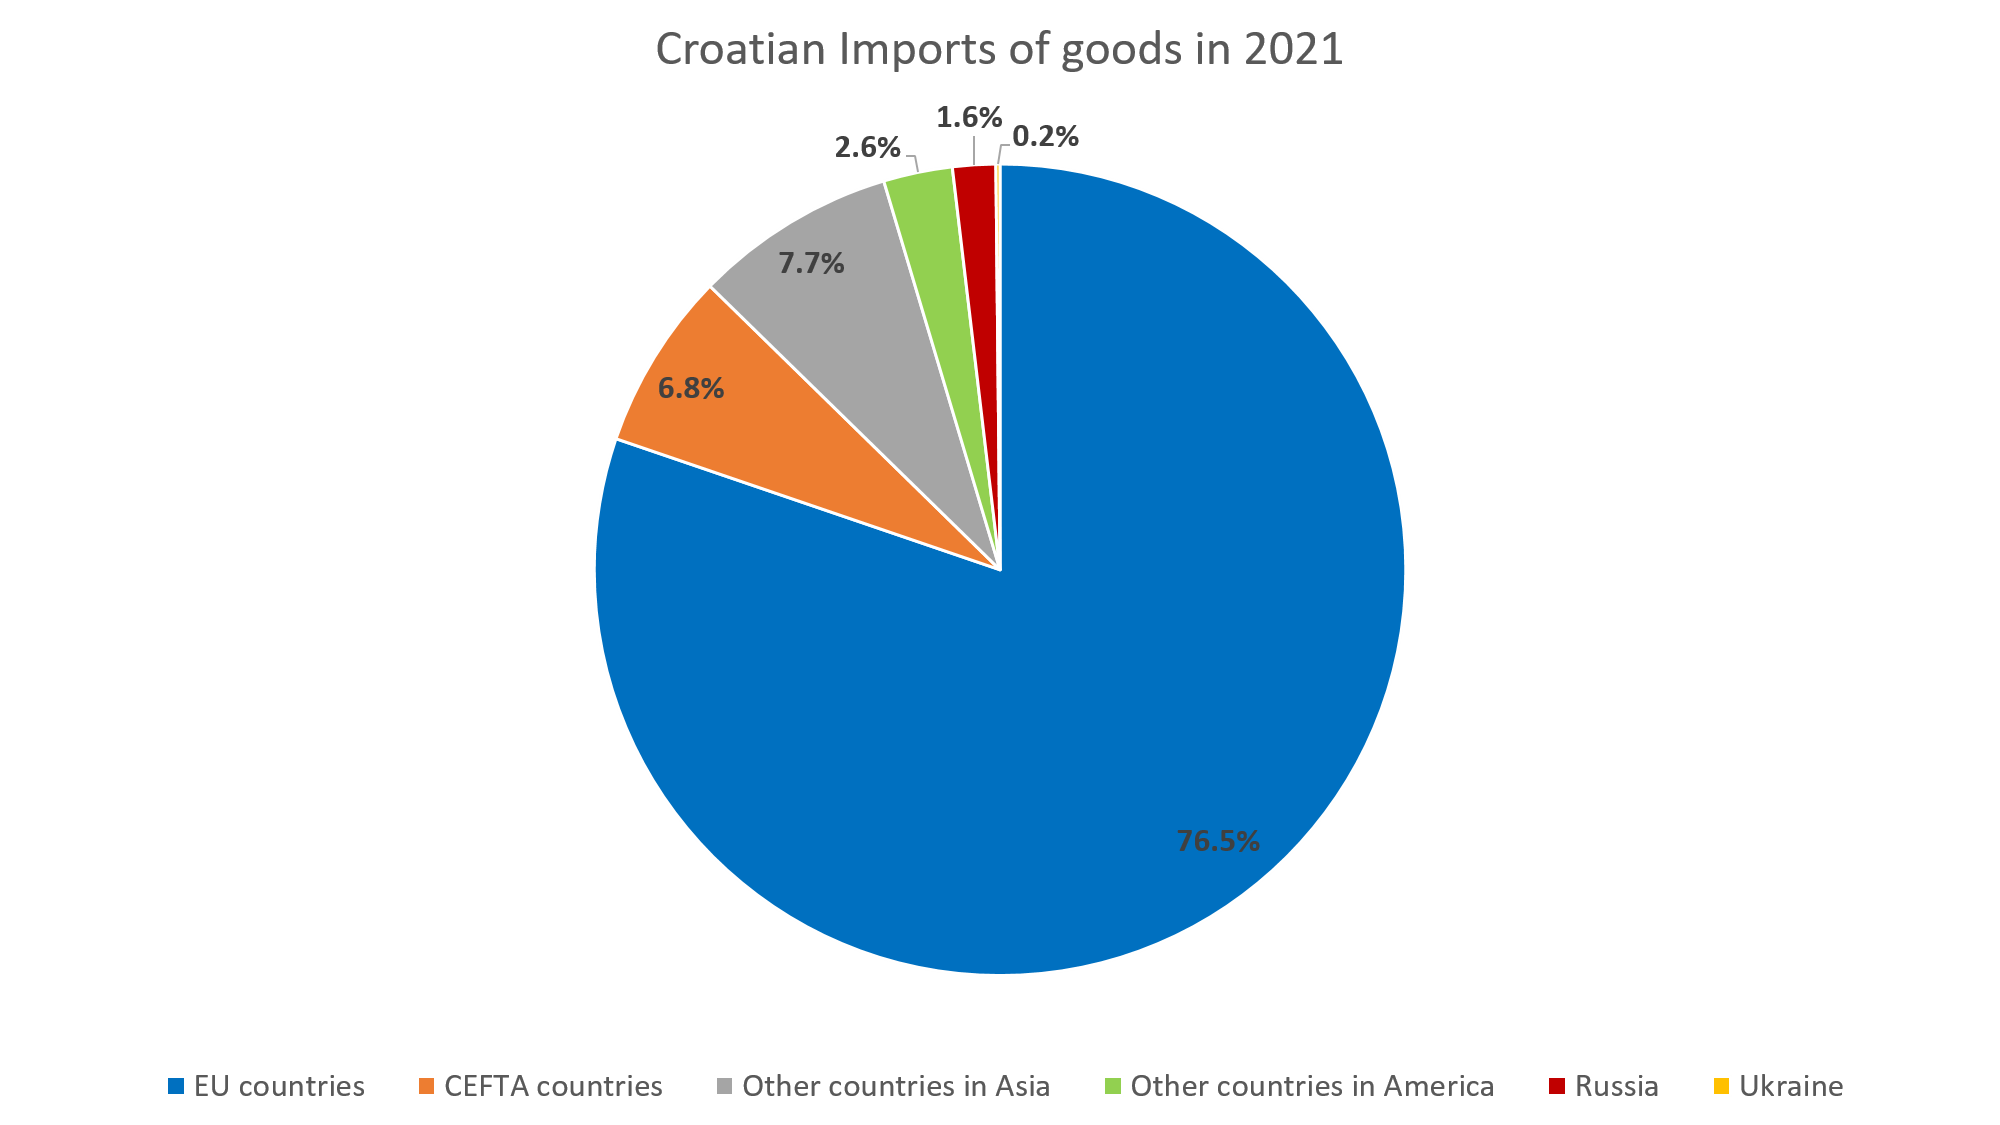
Again, as with the exports, to put it into perspective we can observe the relative share of the Russian and Ukrainian imports compared to other markets. Not surprisingly, EU markets make up the largest share of Croatian imports with 76.5%, followed by CEFTA countries and other countries in Asia with 6.8% and 7.7% respectively. Here we see the same pattern as we did with exports, the Croatian economy is not very reliant on neither Russian nor Ukrainian imports. Moreover, Russia is not even close to Croatia’s biggest importers such as Germany 15%, Italy 13%, Slovenia 11%, Hungary 7%, and Austria 6%.
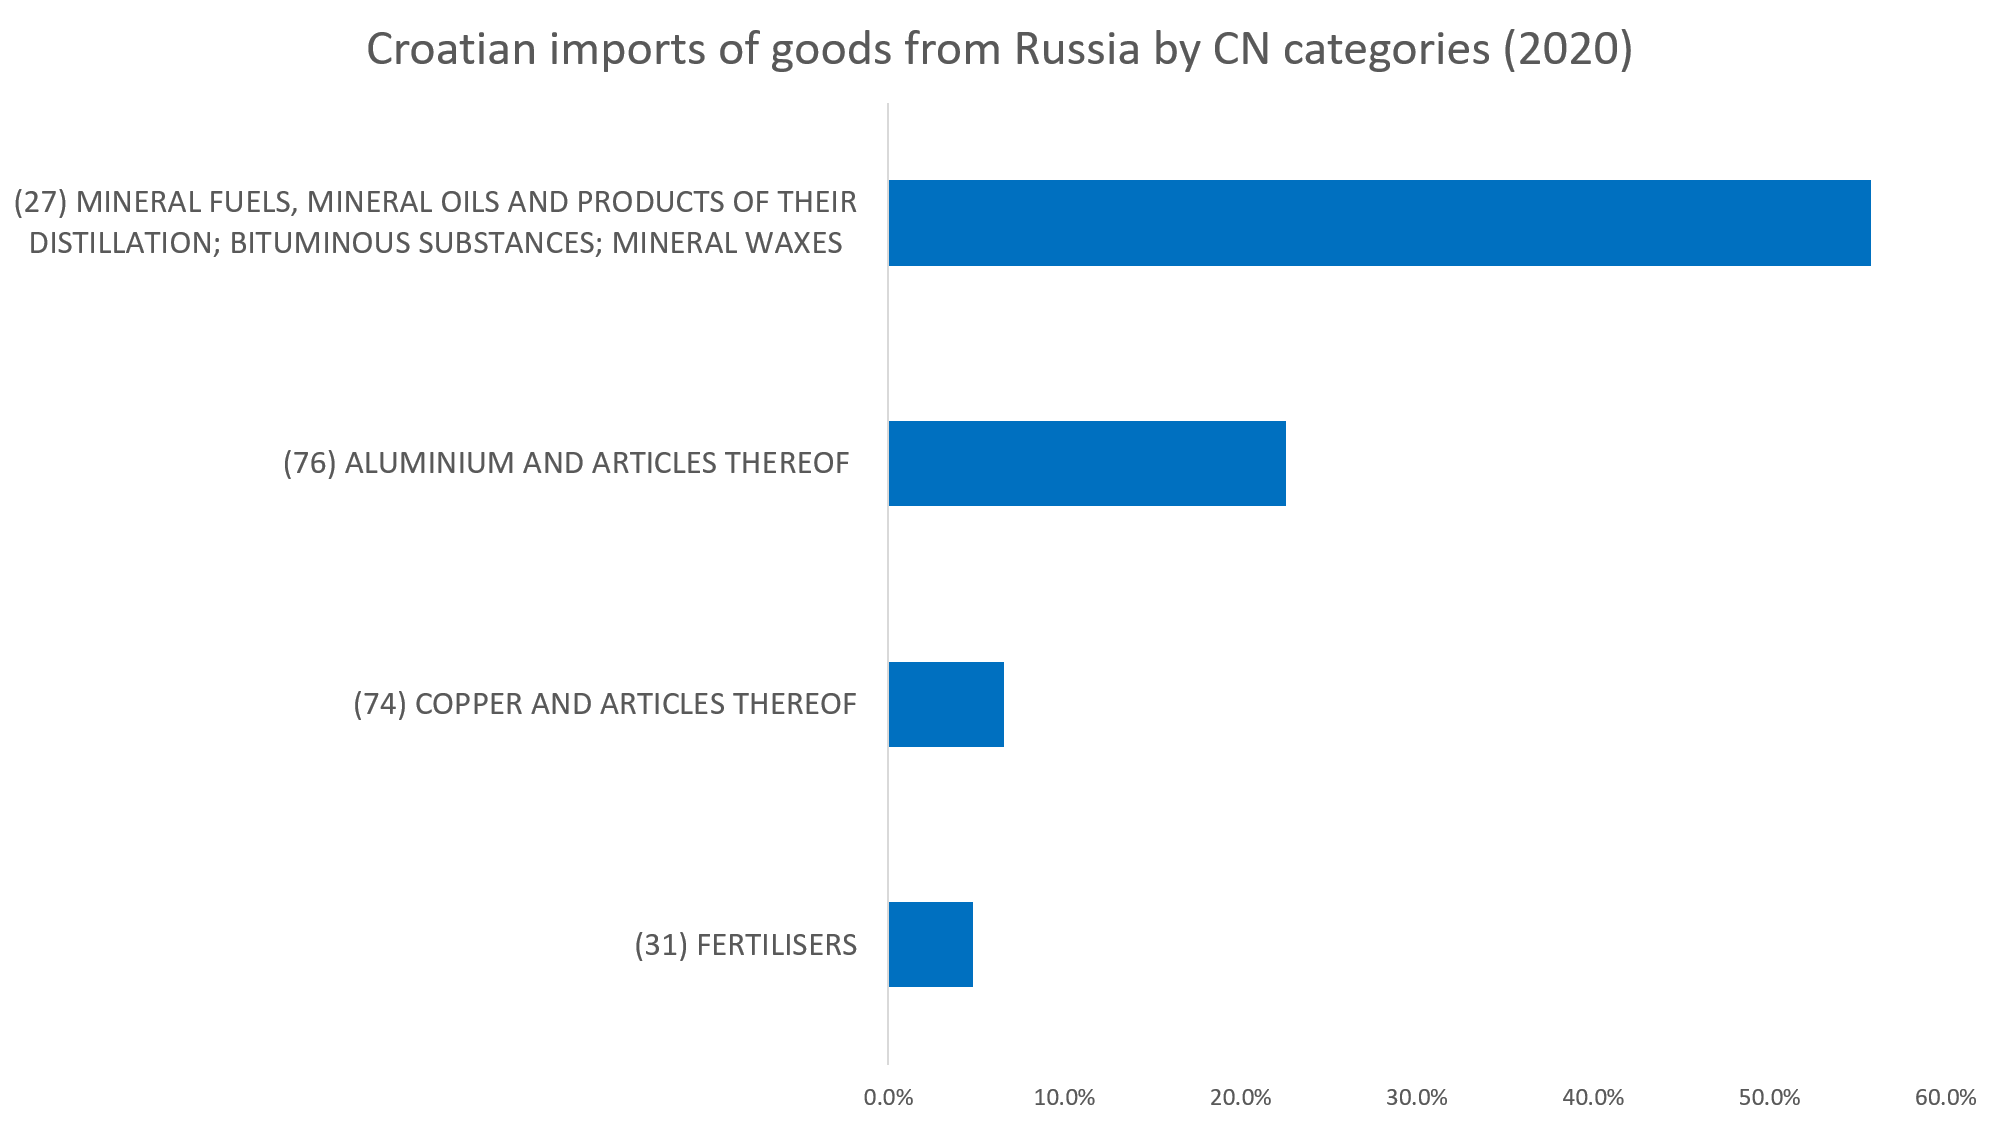
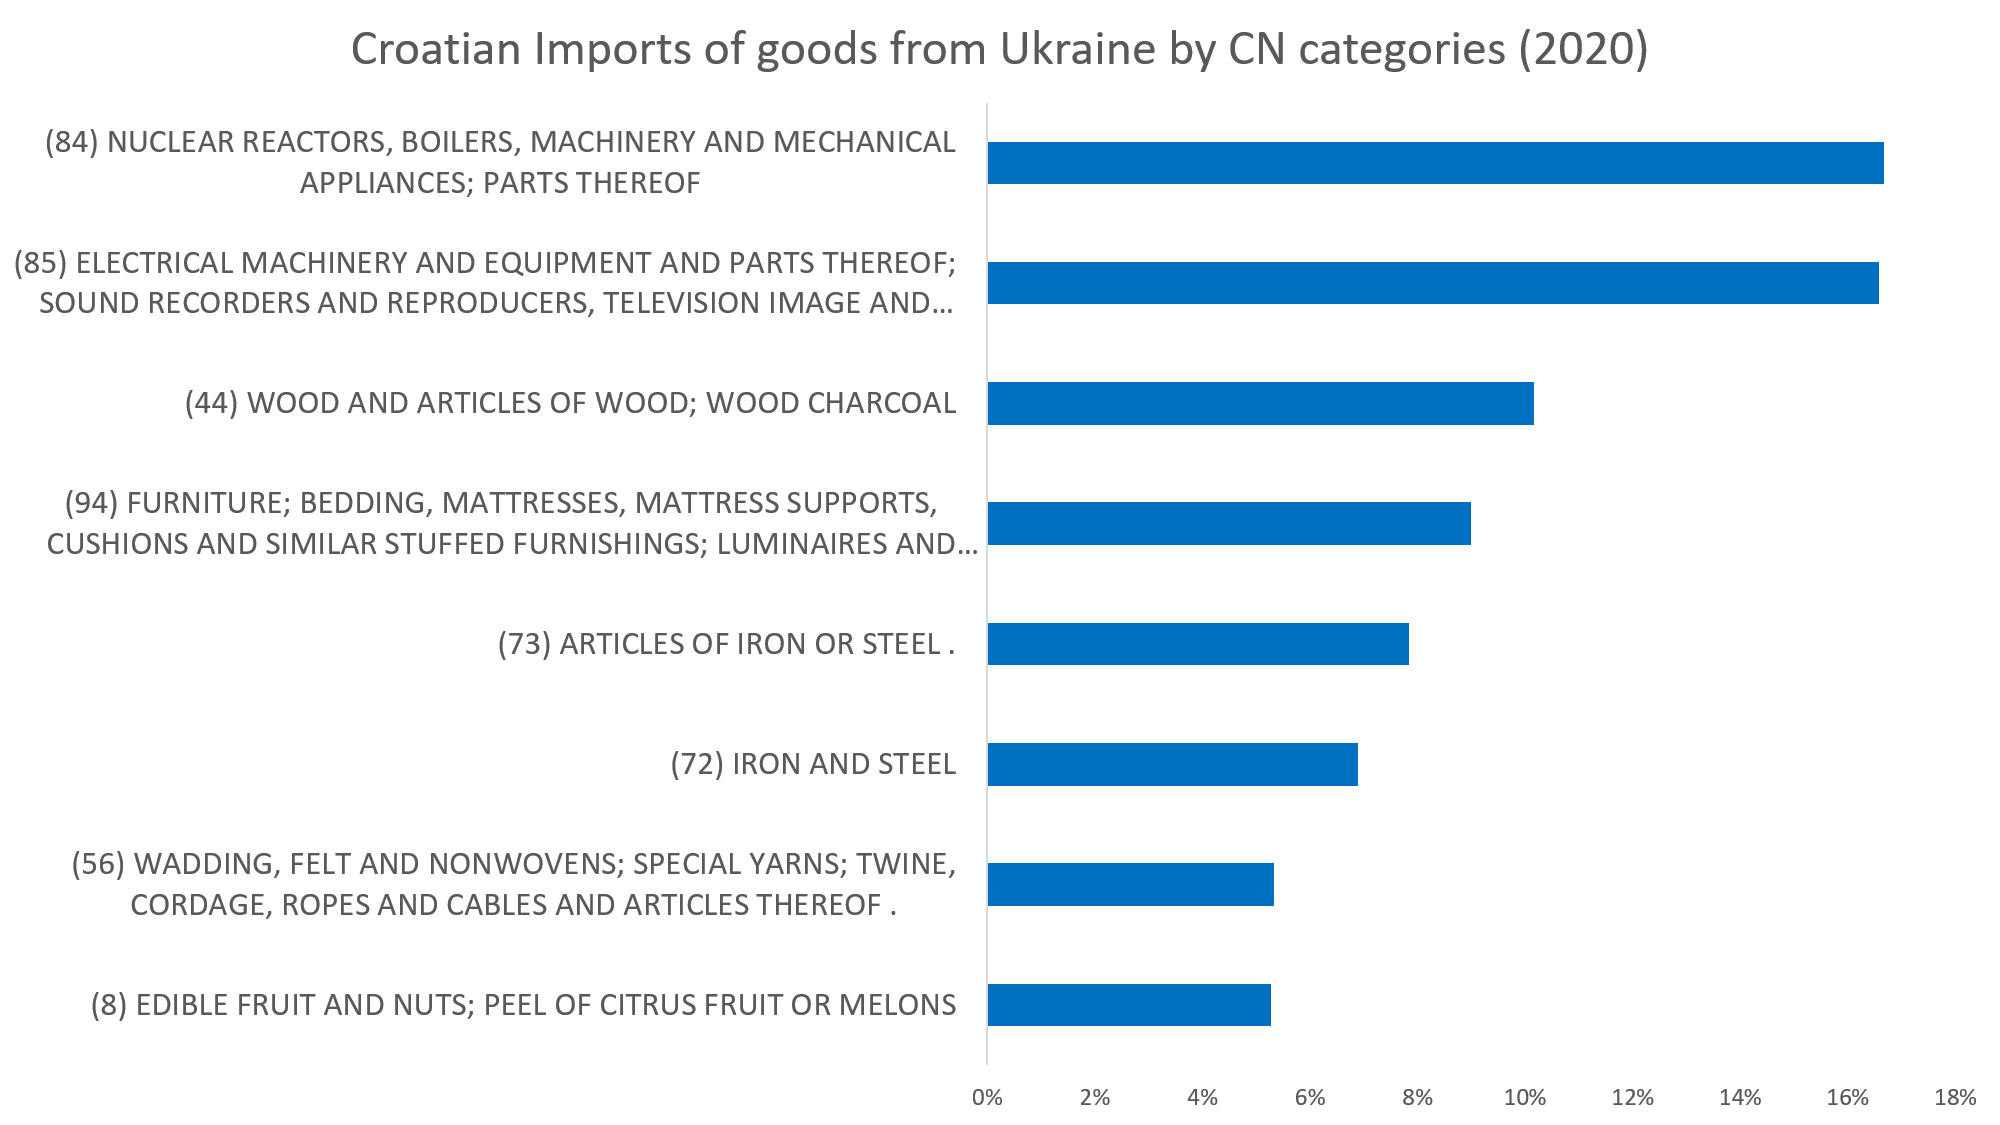
When observing the CN categories, we can see that imports from Russia are dominated by mineral fuels and oils which make up 55.8% of total imports from Russia. However, the relative share of mineral fuels and oils from Russia makes up just 6.6% of total Croatian imports of the same category. Not surprisingly other important categories are metals such as aluminum and copper as well as fertilizers.
Croatian imports from Ukraine are more evenly distributed and two main categories are (84) and (85) which together account for 1/3 of imports and these are both important export categories to Ukraine as well.
BALANCE OF TRADE
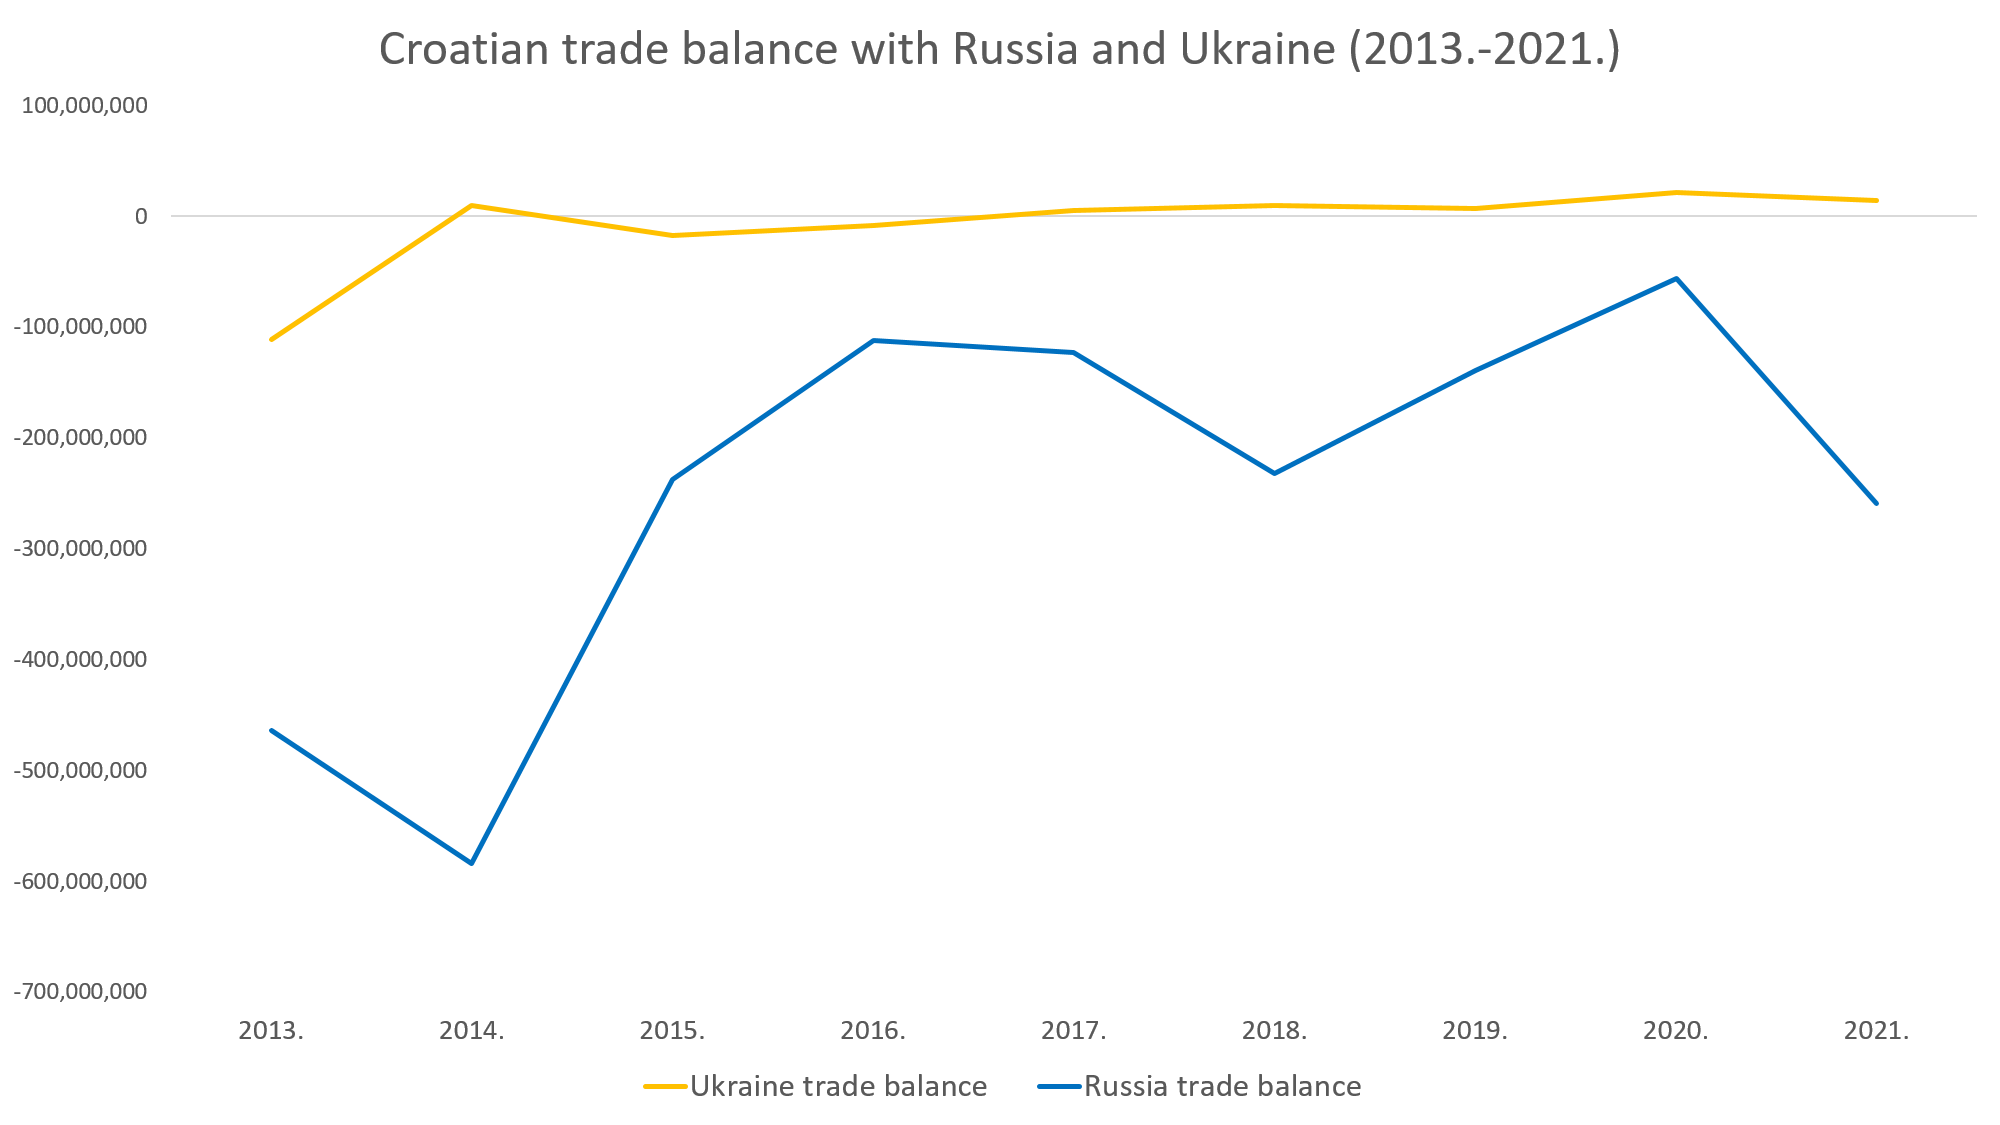
As seen on the graph below, Croatia ended 2021 with a positive trade balance with Ukraine in the amount of 14 million Euros. Since 2017 Croatia has maintained a trade surplus with Ukraine. On the other side, the Croatian trade balance with Russia was negative throughout the whole observed period. In 2021 Croatia had a trade deficit in the amount of 259 million Euros.
To conclude Croatian foreign trade of goods is not very reliant on the Russian and Ukrainian markets, but the Croatian economy will still suffer the consequences of the imposed sanctions on Russia and from the resulting crisis. Some industries and even more companies are more exposed to these markets and they will hopefully manage this crisis in the best way they can. On the contrary, even though the trade relation with Russia and Ukraine is relatively insignificant, Croatia’s biggest trade partners are mostly European countries which are all impacted to a large extent and the spill-over effect is unfortunately unavoidable.
If you want to find out how the Russian Invasion of Ukraine has impacted the Croatian equity market click here.
All the information provided in this article is taken from the Croatian Bureau of Statistics.
For more, check out our business section.