
October 22, 2020 – The latest official COVID-19 in Croatia weekly report has been released by the Koronavirus government website, covering October 12 to October 8.
| Tested | Confirmed cases | Active cases | Recovered | Self-isolation | Hospitalized | On a respirator | Deaths | |
| 400 636 (+3636*) | 25973 (+393*) | 5070 | 20529 | 21329 | 571 | 35 (+5*) | 374 (+11*) | |
| A total of 267 people died in this epidemic wave. Most of the deceased had significant comorbidities or were of advanced age. The average age of the deceased in this epidemic wave is 77.1 years. One hundred and eight people died on a respirator. | ||||||||
* in the last 24 hours
There are currently 26 testing places in the Republic of Croatia that perform RT-PCR analysis and collect samples. All processed samples enter national Croatian Health Insurance Institute platform, which is accessible to all county public health institutes. County public health institutes submit data about positive cases, sources of infection and hotspots as part of their daily reports to the Croatian Institute of Public Health. The Croatian Institute of Public Health collects information about hotspots, hospital treatment of COVID-19 positive persons, COVID-19 positive patients on respirators and the deceased. You can find more about the test centers on the link.
Epidemiological indicators on 19th of October 2020
- Cumulative 7-day rate for the Republic of Croatia: 130,9/100 000
- Cumulative 14-day rate for the Republic of Croatia: 200,0/100 000
- Counties with a cumulative 7-day rate greater than 50/100 000 inhabitants: Grad Zagreb, BBŽ, BPŽ DNŽ, KŽ, KKŽ, KZŽ, LSŽ, MŽ, OBŽ, PSŽ, PGŽ, SMŽ, SDŽ, ŠKŽ, VŽ, VPŽ, VSŽ, Zagrebačka
- Counties with a cumulative 14-day rate greater than 100/100 000 inhabitants: Grad Zagreb, BBŽ, DNŽ, KŽ, KZŽ, LSŽ, MŽ, OBŽ, PSŽ, SMŽ, SDŽ, VŽ, VPŽ, VSŽ, Zagrebačka
- Total number of tests in the last week: 39 660
- Share of positive tests in the total number of tests in the last week: 13,5%
- Total number of tests and share of positive tests in total number of tests: 400 636; 6,5%
- The number of new cases in intensive care per 100,000 inhabitants in the last 7 days: 0,68/100 000
- Number of deaths in the last week: 47
- Total death rate per 1 000 000 population: 91,5/1 000 000
Epidemiological situation in Croatia
Geographical distribution of new COVID-19 cases by counties
In a two-week period from 13th October to 19th of October all counties recorded new cases of COVID-19 disease. The highest number of new cases are recorded in the City of Zagreb, followed by the Splitsko – dalmatinska and Osječko-baranjska County. The lowest number of new cases were recorded in Istarska and Koprivničko-križevačka County. The Krapinsko-zagorska County also has the highest 14-day rate, followed by Ličko-senjska and Međimurska County.
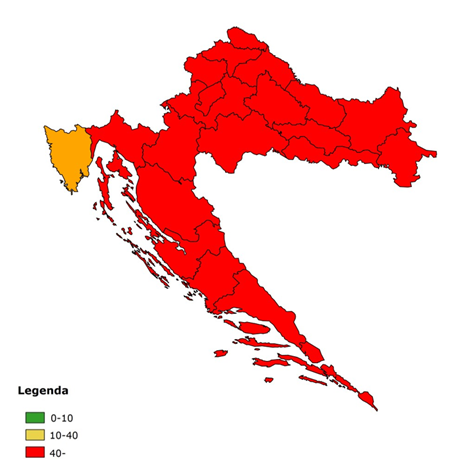
Figure 1. 14-day rate by counties in Croatia on October 19, 2020.
| County | |
| IC | 28,7 |
| KKC | 66,8 |
| ŠKC | 79,9 |
| PGC | 81,3 |
| BPC | 82,1 |
| ZADARSKA | 83,3 |
| BBC | 151,1 |
| PSC | 159,1 |
| VC | 164,7 |
| SDC | 187,9 |
| ZAGREBAČKA | 195,2 |
| SMC | 199,9 |
| DNC | 209,5 |
| OBC | 226,9 |
| VSC | 233,2 |
| KC | 235,4 |
| VŠC | 272,4 |
| CITY OF ZAGREB | 297,6 |
| MC | 308,4 |
| LSC | 345,3 |
| KZC | 460,3 |
| TOTAL | 200,0 |
Figure 1. 14-day rate by counties in Croatia on October 19, 2020.
Epidemic by weeks, from 28th – 34th week of the epidemic
Table 1 shows the epidemiological indicators by epidemic week. The data shows that one of the most important epidemiological indicators – the rate of confirmed cases and the share of positive ones show a positive trend in the period from 28th to 31st week, while in the 32nd and 34th week they grow again with a very large jump at 33rd and 34th week compared to the week before. The confirmed case rate has been steadily declining since week 31 when it stood at 31,2 to grow again at 32nd and 34th week. The number of new cases increased by 84.8% compared to the week before. The total number of tests, after a slight decline in 32nd and 33rd week, it rose again in 34th week and a total of 38,485 tests were performed. The proportion of positive individuals in total testing also declined by 31st week, and increased at 32nd and 34th week.
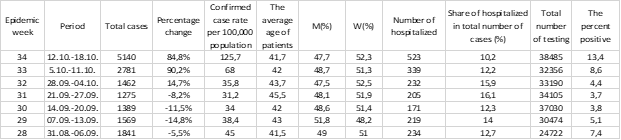
Table 1. Overview of the number of confirmed cases by weeks, from week 28 th to 34th
Table 2 shows a set of indicators related to the severity of the clinical picture and the characteristics of deaths. The table shows that in the period from 28th to 31st week, there has been an increase, and at 32nd and 33rd week a slight decrease in the number of cases on the respirator. At 34th week, there was a significant increase in the number of cases on the respirator, but the share of cases on the respirator in the total and the weekly number of cases did not increase. The share of hospitalized cases in the weekly number of cases ranges from a minimum of 35% to a maximum of 77.1%. The average age of who died does not oscillate significantly. The death rate in the latter stagnated from 29th to 33rd week and increased in 34th week.
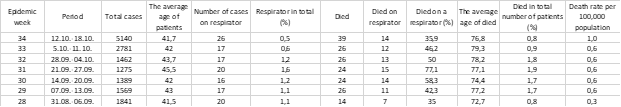
Table 2. Overview of patients on respirator and deaths by weeks, from week 28 to 34
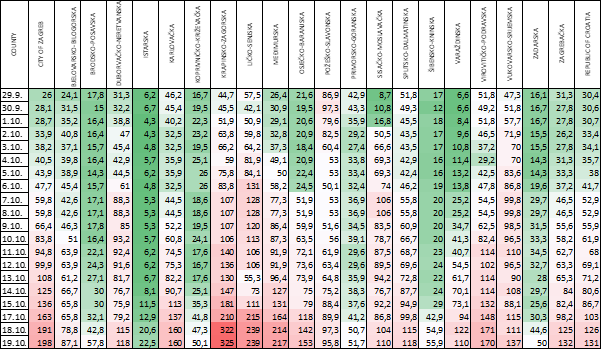
Table 3 shows the incidence of the 7-day rate in the two last weeks with a limit of 50/100 000 inhabitants, which in some countries is taken as one of the criteria in assessing the epidemiological situation. After the epidemiological situation calmed down in early October, due to the re-influx of new cases, rates rose again in most counties.
Clinical aspects – Hospitalizations and severity of clinical picture for the period from 13th October to 19th of October
Figure 2 shows the relationship between the daily number of confirmed cases and the daily number of hospitalized cases. Number of hospitalized cases per day ranged between a minimum of 54 and a maximum of 117, while the share of hospitalized cases in the total daily number of confirmed cases ranged from 7.7% to 18.1%.
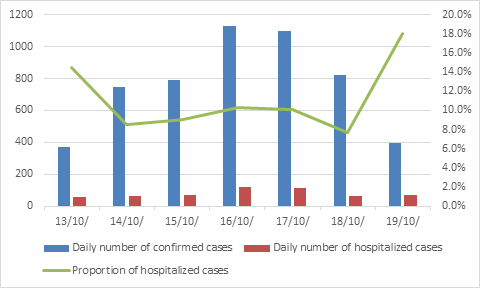
Figure 2. Overview of the daily number of confirmed and hospitalized cases from 13th to 19th of October
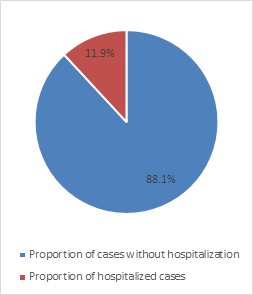
Figure 3 shows the proportion of hospitalized in the total number of weekly cases. Of the total number of confirmed cases in a given weekly period, 10.3% were hospitalized, which is an decrease compared to last week’s 11.9%. In the same period, 28 people were put on a respirator, which makes 0,5% of the total number of confirmed cases. On October 19, there were 35 people on the respirator, or 0.7% of the total number of active cases.
The graph in Figure 4 shows that the slope of the curve of confirmed cases is followed by the curve of cured cases, while the curve of active cases, in addition to some ascending, shows stagnation in certain periods related to the continuation of the first wave of the epidemic in Croatia. After changing the duration of isolation of patients, a sharp decline in the number of active cases is recorded and after which the number of active cases stagnated for two weeks, only to grow again in the last two weeks.
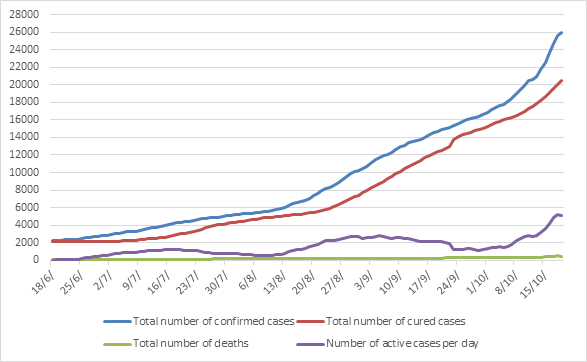
Figure 4. Movement of the total number of cases, recovered, deceased and active number of cases from 18th of June till 19th of October
Age-sex distribution of COVID-19 deaths
A total of 267 people died in this wave of epidemics. Most of the people who died had significant comorbidities or were of advanced age. The mean age of the deceased in this wave of epidemics is 77.1 years. One hundred and eight people died on a respirator. An overview of the situation is given in Table 4 and Figure 5.
| AGE GROUP | 30-39 | 40-49 | 50-59 | 60-69 | 70-79 | 80-89 | 90-99 | 100+ |
| MEN | 0 | 1 | 13 | 28 | 56 | 42 | 9 | 0 |
| WOMEN | 1 | 0 | 0 | 17 | 32 | 50 | 17 | 1 |
Table 4. Died people by age and gender in the period from 29th of June till 19th of October
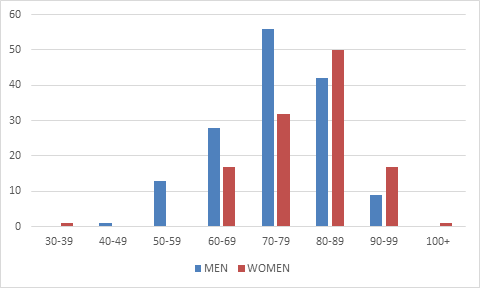
Figure 5. Age and sex distribution of deaths from COVID-19 in the period 29th of June to 19th of October 2020
Deaths for the period from 13th to 19th of October
In the last week, 27 people died, of which 15 (55.6%) were on a respirator. The distribution by age and sex in the last weeks is shown in Table 5, and by counties in Table 6.
| AGE GROUP | 50-59 | 60-69 | 70-79 | 80-89 | 90-99 |
| MEN | 0 | 2 | 5 | 6 | 10 |
| WOMEN | 1 | 0 | 2 | 7 | 8 |
Table 5. Distribution by age and sex of persons who died in the last week
| County | Number of new cases in the period 13.10.-19.10. |
Incidence of new cases in the last 7 days on 100 000 inhabitants |
Number of deaths in the period 13.10.-19.10. |
Total number of deaths | Total mortality rate at 1,000,000 inhabitants |
| CITY OF ZAGREB | 1590 | 197,6 | 15 | 71 | 88,3 |
| BJELOVARSKO-BILOGORSKA | 94 | 87,1 | 4 | 10 | 92,7 |
| BRODSKO-POSAVSKA | 81 | 57,8 | 0 | 6 | 42,8 |
| DUBROVAČKO-NERETVANSKA | 143 | 118,0 | 1 | 16 | 132,0 |
| ISTARSKA | 47 | 22,5 | 1 | 14 | 67,1 |
| KARLOVAČKA | 187 | 160,1 | 3 | 7 | 59,9 |
| KOPRIVNIČKO-KRIŽEVAČKA | 54 | 50,1 | 0 | 18 | 167,1 |
| KRAPINSKO-ZAGORSKA | 407 | 324,7 | 2 | 7 | 55,8 |
| LIČKO-SENJSKA | 108 | 239,0 | 4 | 6 | 132,8 |
| MEĐIMURSKA | 238 | 216,5 | 1 | 1 | 9,1 |
| OSJEČKO-BARANJSKA | 425 | 153,3 | 2 | 32 | 115,4 |
| POŽEŠKO-SLAVONSKA | 65 | 95,8 | 0 | 6 | 88,4 |
| PRIMORSKO-GORANSKA | 147 | 51,7 | 1 | 17 | 59,8 |
| SISAČKO-MOSLAVAČKA | 164 | 110,4 | 3 | 11 | 74,0 |
| SPLITSKO-DALMATINSKA | 530 | 118,3 | 5 | 78 | 174,1 |
| ŠIBENSKO-KNINSKA | 56 | 55,9 | 0 | 8 | 79,9 |
| VARAŽDINSKA | 184 | 110,2 | 0 | 4 | 24,0 |
| VIROVITIČKO-PODRAVSKA | 128 | 170,1 | 1 | 12 | 159,5 |
| VUKOVARSKO-SRIJEMSKA | 212 | 137,3 | 0 | 17 | 110,1 |
| ZADARSKA | 84 | 50,0 | 0 | 9 | 53,5 |
| ZAGREBAČKA | 408 | 131,8 | 4 | 24 | 77,6 |
| TOTAL | 5352 | 130,9 | 47 | 374 | 91,5 |
Table 6. New patients and deaths in the last week and total deaths
Epidemiological situation in Croatia
In the last week, new cases have been reported in all counties of continental and coastal Croatia. The highest 7-day rates on 19th October were recorded in continental Croatia, in Krapinsko-zagorska (324.7) and Međimurska County (216.5), followed by the City of Zagreb (197.6) and Virovitičko-podravska (170.1) and Karlovačka County (160.1). In coastal counties, the lowest rate was recorded for a longer period of time in Istarska County (22.5), while higher rates were recorded in other coastal counties. However, they are still significantly lower than in the mainland. Despite the large increase in the number of patients, there are no recorded outbreaks with a large grouping of patients, but it is mainly a large number of hotspots and smaller groupings that certainly have a significant impact on the general epidemiological situation in the country. Patients associated with family gatherings of various contents and circumstances (most often religious rites, birthdays, weddings), celebrations or banquets, choir singing, going out or training and competitions of various sports clubs are still recorded. From these activities of everyday life, infection is transmitted to the work environment, and in that way, there’s no work environment which is spared the possibility of more infected people appearing in it. This is how virus outbreaks are recorded and monitored in health care institutions, most often hospitals, but also occasionally in social care institutions, are recorded and monitored. The same principle applies to educational institutions, among which the most infected are in high schools. A significant proportion of sufferers are contacts of previously ill cases.
Age-sex distribution of patients in the last week
In the previous week, a total of 5352 people fell ill – a slightly higher proportion of females (52.5%) than males (47.5%). A similar distribution by sex is present in most age groups, except in age groups up to 1 year of age and from 1 to 7 years where a higher percentage of sick kids are boys. By age groups – approximately the same percentage of patients was recorded in the age groups of children (11.3%) and the elderly (12.4%).The most affected were children of high school age, a total of 310. Adults in the age range of 19 to 65 years made the largest share in the total number of patients last week, actually 4082 (76.3%). The distribution of patients by age did not change significantly compared to last week, except that the share of sick people aged 66 and over increased slightly, from 11.8% to 12.4%. The full view can be found in Figure 6 and Table 7.
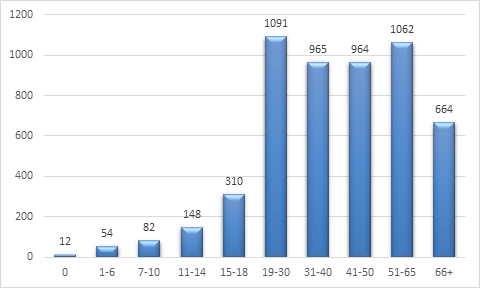
Figure 6. Distribution of patients in the last week by age groups
| AGE GROUP | M | W | TOTAL | SHARE | |||||
| KIDS | 0 | 7 | 58,3% | 5 | 41,7% | 12 | 606 | 0,2% | 11,3% |
| 1-6 | 36 | 66,7% | 18 | 33,3% | 54 | 1,0% | |||
| 7-10 | 44 | 53,7% | 38 | 46,3% | 82 | 1,5% | |||
| 11-14 | 71 | 48,0% | 77 | 52,0% | 148 | 2,8% | |||
| 15-18 | 166 | 53,5% | 144 | 46,5% | 310 | 5,8% | |||
| ADULTS | 19-30 | 532 | 48,8% | 559 | 51,2% | 1091 | 4082 | 20,4% | 76,3% |
| 31-40 | 461 | 47,8% | 504 | 52,2% | 965 | 18,0% | |||
| 41-50 | 436 | 45,2% | 528 | 54,8% | 964 | 18,0% | |||
| 51-65 | 513 | 48,3% | 549 | 51,7% | 1062 | 19,8% | |||
| ELDERS | 66+ | 275 | 41,4% | 389 | 58,6% | 664 | 664 | 12,4% | 12,4% |
| TOTAL | 2541 | 47,5% | 2811 | 52,5% | 5352 | 100,0% | |||
Table 7. Age and sex distribution of patients in the period form from 13th to 19th of October
Measures
Since the initial adjustment of the measures started at the end of April for the purpose of continuing economic and social activities, measures to maintain physical distance, maintain hand hygiene and disinfection, obligation to wear face masks or medical masks in certain enclosed spaces and for all health professionals, social care providers and employees in catering facilities, and restrictions on the numbers of people at private and public gatherings are continuously in force.
From the end of August, at the suggestion of local headquarters, targeting measures were adopted at the local level. Most of them referred to restrictions on the number of people at weddings, funerals and other private gatherings, measures to organize larger events, bans on visits to hospitals, homes for the elderly people and audiences at sports competitions.
The following decisions were made last week:
- Decision on amendments to the Decision ABOUT the introduction of necessary epidemiological measures for the area of Krapina-Zagorje County (October 19, 2020)
- Decision amending the Decision about the introduction of necessary epidemiological measures for the Primorje-Gorski Kotar County (October 19, 2020)
- Decision amending the Decision about the introduction of necessary epidemiological measures for the area of Sisak-Moslavina County (October 19, 2020)
- Decision about the introduction of necessary epidemiological measures for the area of the City of Zagreb (October 16, 2020)
- Decision on amendments to the Decision about necessary measures for the organization of gatherings attended by more than fifty participants during the declared epidemic of the disease COVID-19 (October 15, 2020)
- Decision about exceptional suspension of the necessary measure of mandatory use of face masks or medical masks for guests in catering facilities in the territory of the County of Istria (October 15, 2020)
- Decision about the introduction of necessary epidemiological measures for the area of Varaždin County (October 15, 2020)
- Decision on Amendments to the Decision about Introduction of Necessary Epidemiological Measures for the Area of Šibenik-Knin County (October 14, 2020)
- Decision amending the Decision about the introduction of necessary epidemiological measures for the area of Međimurje County (October 14, 2020)
- Decision amending the Decision about the introduction of necessary epidemiological measures for the area of Lika-Senj County (October 14, 2020)
- Decision amending the Decision about the temporary ban on crossing the border crossings of the Republic of Croatia (October 14, 2020)
- Decision about temporary regulation of work and working hours in catering (October 13, 2020)
Last week, new versions of the recommendations of the Croatian Institute of Public Health were published regarding catering, wedding celebrations, professional performances of cultural programs and events, wearing masks and in other circumstances beyond those provided by the decision of the Civil Protection Headquarters.
- Recommendations for the use of face masks, medical and protective masks – ver. 3. It is recommended to wear face masks in all circumstances where the necessary physical distance between people cannot be maintained during their stay outdoors.
- Recommendations for the prevention of COVID-19 infection during professional art performances, cultural programs and events – ver. 5. The recommendations provide wearing face masks during the stay indoors for the duration of professional artistic performances.
- Recommendations for the prevention of infection in catering facilities with and without terraces and in catering facilities in accommodation facilities. Recommendations includes nightclubs and bars, as well as family farms that offer catering services. The changes relate to limiting the number of people who may be present in the facility at the same time. They introduce the term of COVID guard, the obligation of wearing masks for guests while sitting at a table and abolition of standing places and the dance floors. Working hours are recommended until 24:00. It is also recommended to buy tickets online. For visitors to nightclubs and bars is reccomended to measure the temperature at the entrance and to record participants.
- Recommendations for the prevention of COVID-19 infection during wedding ceremonies and celebrations. Recommendations include changes related to limiting the number of people who may be present at the facility at the same time. They introduce the concept of COVID guard, the obligation of wearing masks for guests while sitting at the table, the largest number of people who are allowed to sit at one table and the possibility of dancing is left only to newlyweds and parents or guardians that is, or actually to close family members and only for a solemn dance at the beginning of the wedding celebration. They have been abolished.
- Recommendations for performing food catering activities during the COVID-19 epidemic. The recommendations include changes to limit the number of people allowed to be present at the facility at the same time. They introduce the term COVID guard, the obligation to wear masks for guests until they are sitting at a table.
- Instructions and recommendations for gatherings ver. 2. The instructions are in line with the decisions of the Headquarters, they apply to all gatherings in which more than 50 people participate.
Recommendations and measures on global and EU level
Europe
On 24 th of August 2020, ECDC released an updated version of the risk assessment: https://www.ecdc.europa.eu/sites/default/files/documents/covid-19-risk-assessment-increased-transmission-12th-update-september-2020.pdf
ECDC has additional documents and information available: https://www.ecdc.europa.eu/en, https://www.ecdc.europa.eu/en/covid-19-pandemic
The number of cases and the 7-day cumulative incidence of COVID-19 confirmed cases worldwide can be found on the ECDC dashboard: https://qap.ecdc.europa.eu/public/extensions/COVID-19/COVID-19.html
Austria
Bundesministerium für Soziales, Gesundheit, Pflege und Konsumentenschutz – https://www.sozialministerium.at/Informationen-zum-Coronavirus/Neuartiges-Coronavirus-(2019-nCov).html
Netherlands
Government of the Netherlands – https://www.government.nl/topics/coronavirus-covid-19
National Institute for Public Health and the Environment – https://www.rivm.nl/en/novel-coronavirus-covid-19
Germany
Rober Koch Institut – https://www.rki.de/DE/Home/homepage_node.html
Slovenia
(gov.si) – https://www.gov.si/en/topics/coronavirus-disease-covid-19/
National Institute for Public Health – Slovenia – https://www.nijz.si/en
United Kingdom
gov.uk – https://www.gov.uk/coronavirus
NHS – https://www.nhs.uk/conditions/coronavirus-covid-19/
World
WHO provides comprehensive information and documents.
WHO COVID-19-Dashboard: https://covid19.who.int/, https://www.who.int/emergencies/diseases/novel-coronavirus-2019
Coronavirus disease (COVID-19) Weekly Epidemiological Update and Weekly Operational Update i Weekly Surveillance Report: https://www.who.int/emergencies/diseases/novel-coronavirus-2019/situation-reports, https://www.euro.who.int/en/health-topics/health-emergencies/coronavirus-covid-19/weekly-surveillance-report
Sources of information
https://www.hzjz.hr/
https://zdravlje.gov.hr/
Information about the global epidemiological situation
More about COVID-19 in other countries can be found and learned on the ECDC website: https://www.ecdc.europa.eu/en/geographical-distribution-2019-ncov-cases. The WHO Regional Office for Europe, the European Commission and the European Observatory on Health Systems and Health Policy have at their disposal the COVID-19 Health System Response Monitor (HSRM). There is information available about European countries and ways to respond to this epidemic. The focus is on health systems and public initiatives: https://www.covid19healthsystem.org/mainpage.aspx
Rober Koch Institut – https://www.rki.de/DE/Home/homepage_node.html
Slovenia
World
For the latest travel info, bookmark our main travel info article, which is updated daily.
Read the Croatian Travel Update in your language – now available in 24 languages!
Join the Total Croatia Travel INFO Viber community.
Subscribe to our newsletter
the fields marked with * are requiredRelated posts:
 Mandatory Quarantine for Everybody Coming from BiH and Serbia, Masks on Public Transport
 Coronavirus Cases Rise in BiH: Why is Croatia Opening Borders Now?
 Norway Includes Croatia on ‘Red’ List of Countries Unsafe for Travel
 Croatia Stays on Slovenia’s Yellow List, Countries to Continue Close Cooperation