November 23, 2019 – What are the attitudes and expenditures of tourists in Croatia, and who is spending the most? Some useful insights from a major Croatian tourism survey by TOMAS and the Institute for Tourism.
One of the joys of being an independent writer outside of the system is that you have little easy access to available official information. Yes, there are reports and surveys out there, but not that many are online or publicly available, and so finding data to back up your arguments is an ongoing process.
I had not come across this Croatian tourism survey before, for example. The TOMAS 2017 Attitudes and Expenditures of Tourists in Croatia survey by the Institute of Tourism may be two years old, but it still has plenty of rather interesting data to work with. The report is actually quite current, as this Croatian tourism survey only comes out every three years, with the next one due out in 2020.
The results of the survey were compiled from interviews with 5,950 tourists in hotels, campsites and private accommodation in 67 destinations on the coast and islands between July and October 2017. Respondents came from 20 key Croatian tourism markets. While this survey covered just the coast, the 2020 one will apparently cover the entire country for the first time.
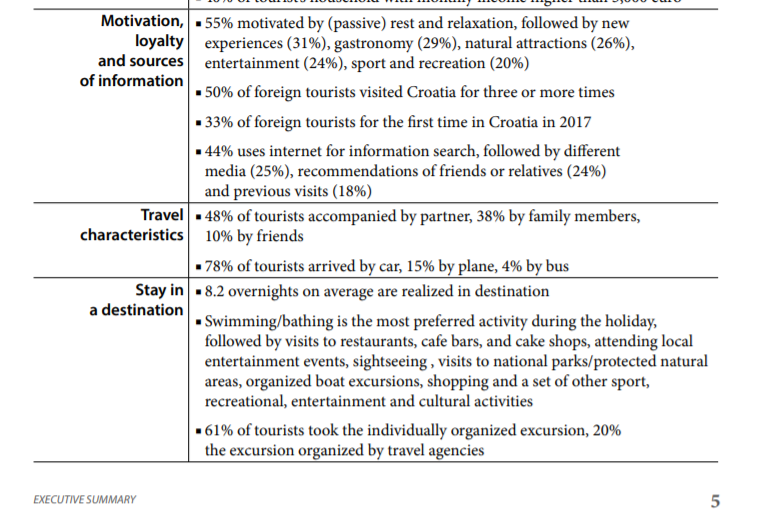
Rather than reinvent the wheel, here are some of the key findings from the executive summary.
The full report is available in Croatian and goes into quite interesting detail on a number of issues by tourism market. It shows how attitudes, experiences and expenditures vary considerably between those countries. I hope the tables will be readable – there is nothing I can do to make them bigger if not – apologies.
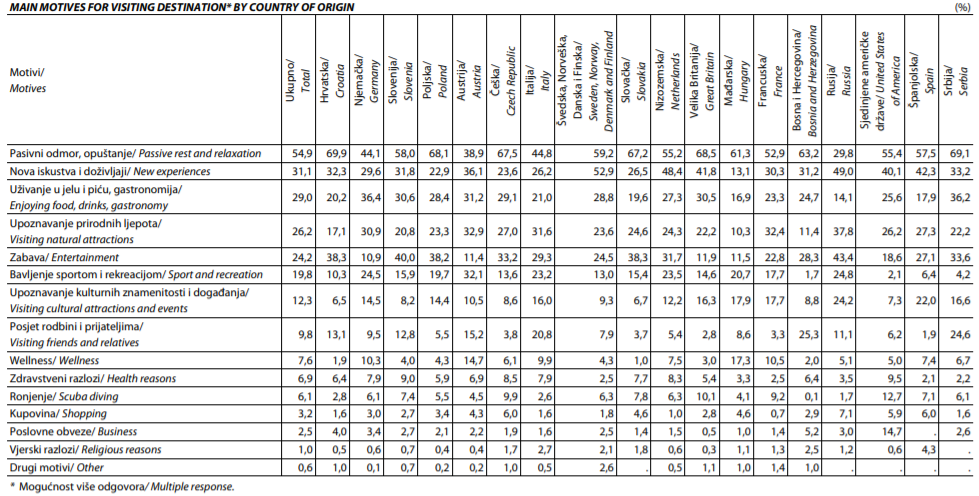
Not surprisingly, the main reason for coming to Croatia on holiday was for rest and relaxation, with Serbs (69%) citing passive rest and relaxation as the main reason, the largest percentage, much more than the Russians at just over 29%.
49% of Russians come for new experiences, however, slightly behind those adventurous Scandinavians, and way ahead of the Hungarians at 13% – they clearly have found what they want and like it.
Interestingly, for a destination so proud of its food and wine, only Serbia (36%) and Austria (31%) cited gastronomy as a key reason. Something for our tourism chiefs to reflect on, perhaps?
Neighbouring Slovenia attributes 40% of its overnight stays to wellness tourism, and yet only Germany and France at 10% made double figures for wellness tourism, while none did for health tourism. This is a HUGE, year-round growth potential for Croatia, and as I reported from Crikvenica recently, it seems that things are finally started to move, albeit slowly.
Another growth potential with better marketing and organisation is religious tourism. While Medjugorje in neighbouring Bosnia and Hercegovina brings more than 1 million tourists a year, the largest level of religious tourism interest is from Spain at just 4.3&%. And unlike Medjugorje, Croatia has an authentic miracle town, fully endorsed by the Vatican.
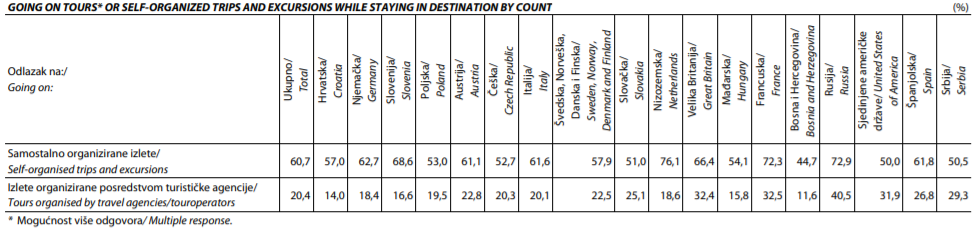
The era of the travel agent seems to be coming to an end with the rise of self-organised trips and excursions, with only Russians using tours from travel agencies in any large quantity these days.
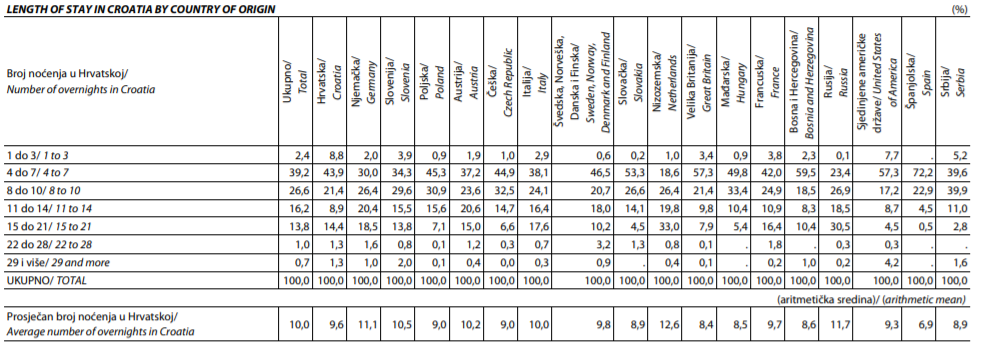
How long do people stay? The Dutch and the Russians are the only ones who come in large numbers for more than 2 weeks (over 30%), while 72% of Spanish visitors stay for less than a week.
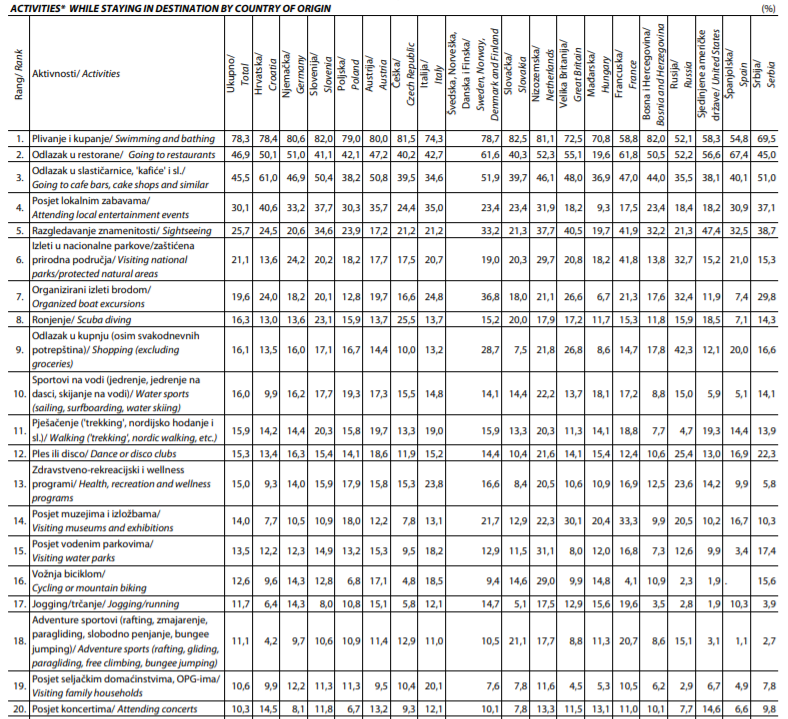
What do tourists like to do when they come to Croatia? Sun, sea, eat, repeat. And not much else tops 40%. One-dimensional tourism, but one which is slowly evolving.
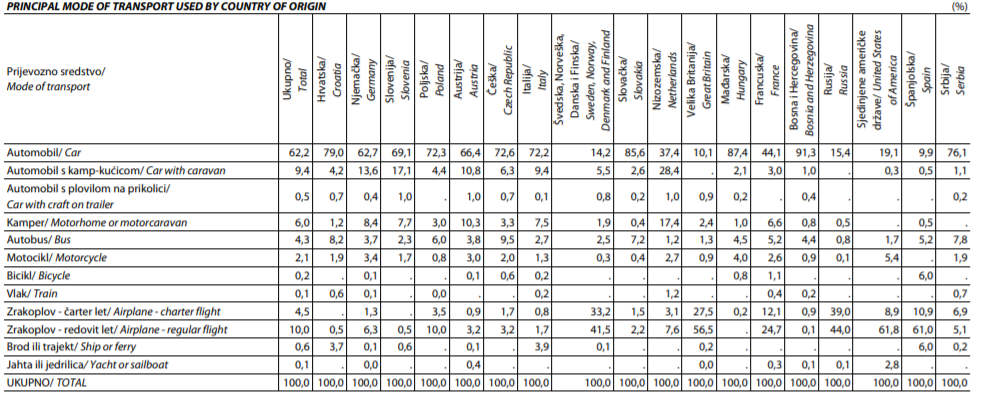
While all those new flight announcements and record passenger numbers show growth in tourists arriving by air, the majority of tourists still arrive by car. And with 21 million electric cars on European roads by 2030, imagine the potential if we could build up Nikola Tesla’s birthplace in Smiljan to a must-visit temple for electric vehicle drivers, in the way that Old Trafford or the Nou Camp celebrate their brands in football.
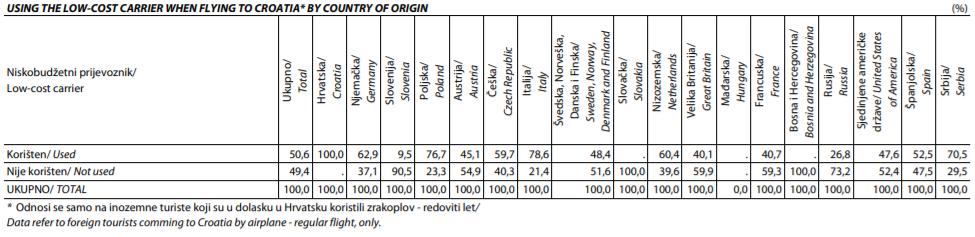
The era of the low-cost carrier has arrived – on the coast at least, if not in Zagreb. Yet.
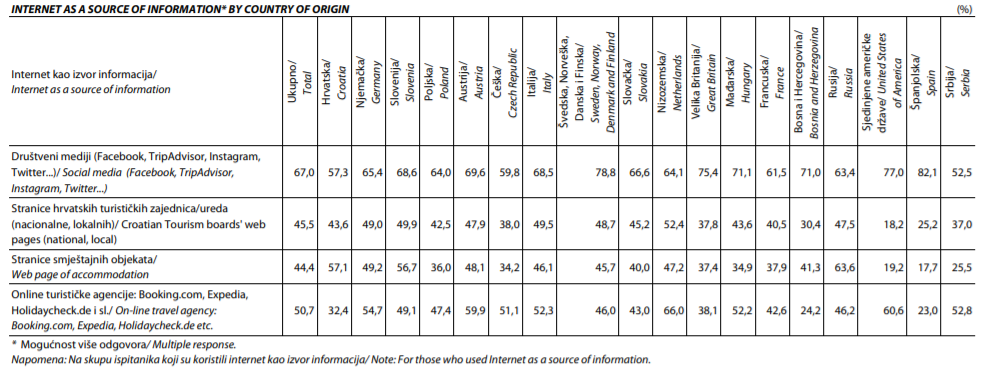
Three of the most interesting markets for me – Scandinavia, the United States and Spain, scored the highest in terms of social media as a source of information.
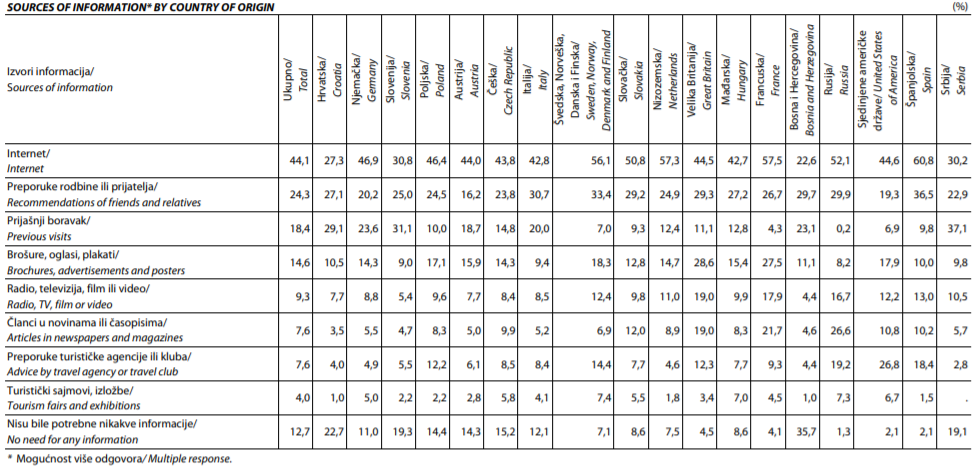
A healthy percentage of people coming because of personal recommendation, but can we finally kill the cult of the printed brochure, please?
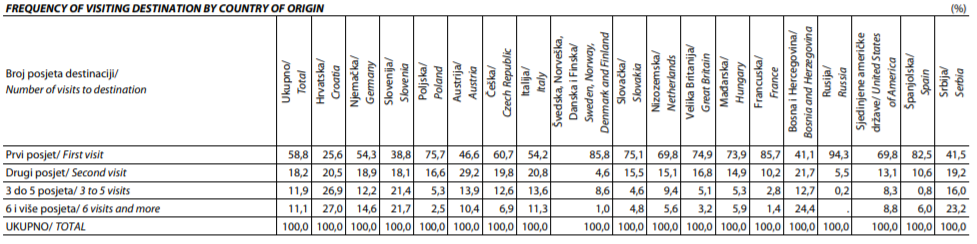
Some interesting findings on customer loyalty (and one must bear in mind that some markets are more mature than others). The most loyal, with almost a quarter of visitors having been 6 times or more, are Bosnia, Serbia and Slovenia. By contrast, the highest percentage of first-time visitors came from Russia (94%), Scandinavia, France and Spain.
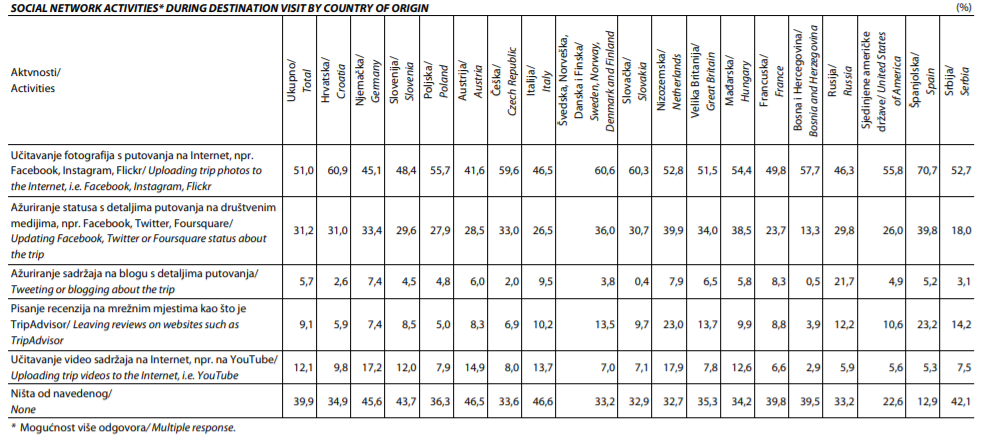
Uploading photos during the trip was most popular among the Spanish, and perhaps these stats represent a clever marketing plan. With the notable exception of Russia (21%) no country topped 10% for tweeting or blogging about their trip. A campaign to encourage this perhaps, something like a free trip for the best tweet/blog?
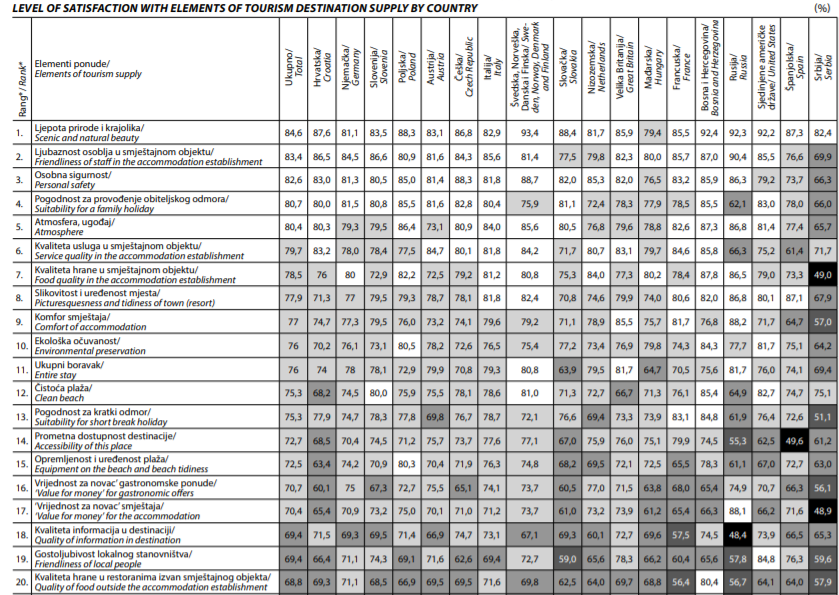
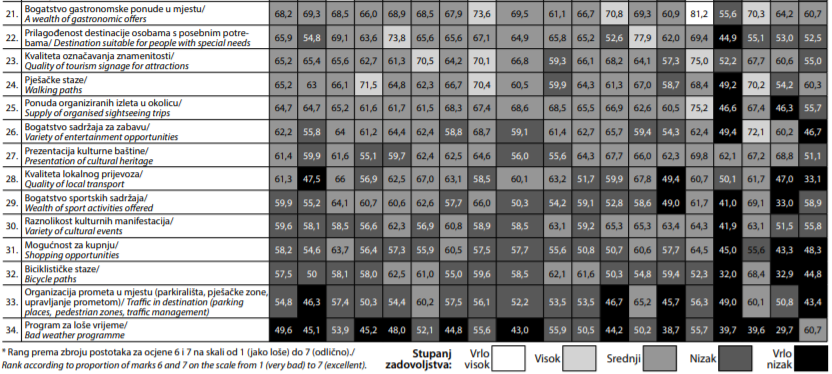
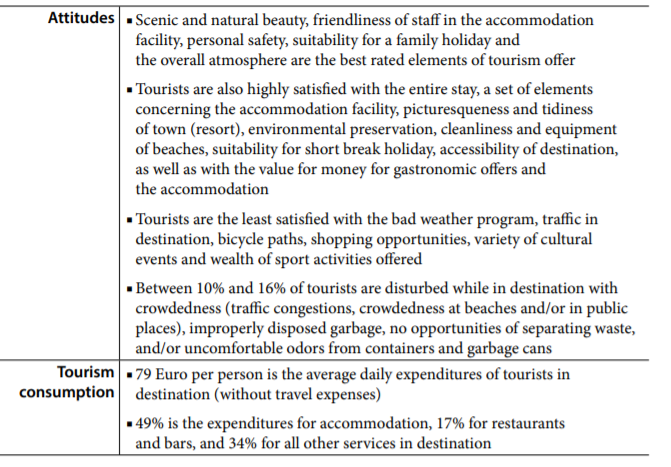
A really useful breakdown of how each market rated a range of experiences, the highlights of which are summarised in the executive summary at the beginning of the article.
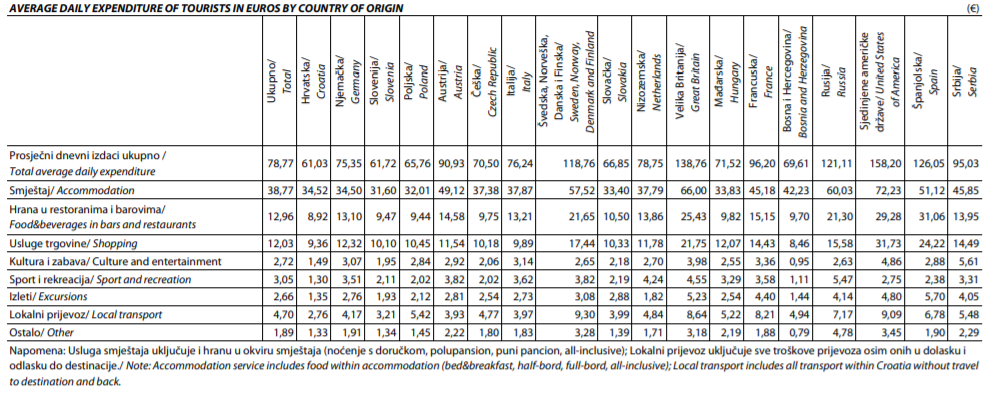
Time for the big one – who is spending the money? There were a few surprises in this one for me, both in the high spenders and the lower spenders (average daily spend is 79 euro). USA the clear winner (158 euro per day), followed by UK, Spain, Russia and Scandinavia, the only countries spending over 100 euro a day. France and Serbia spend 96 and 95 respectively. At the other end, those Central Europeans with their cars full of supplies were below 70 euro a day, which Germany was much lower than I expected (75 euro), a full 15 euro less than Austria. I assume that the reason is linked to so many camping.
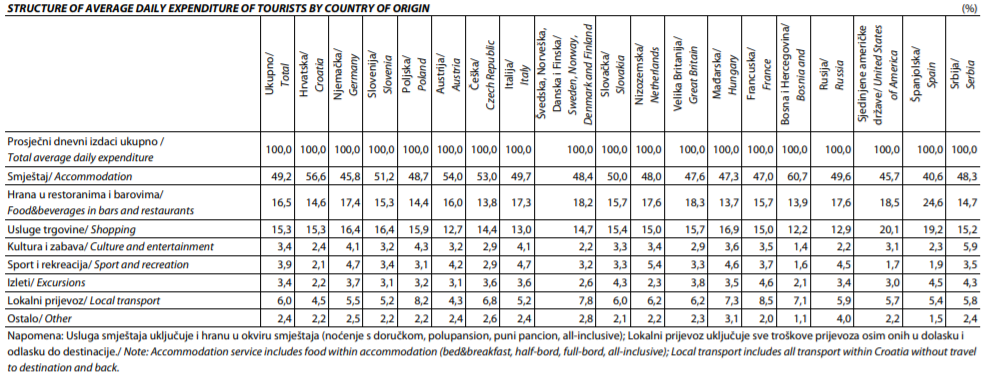
And those Spanish love to eat, easily the highest spenders on restaurants and bars, both in terms of actual euros and percentage of spend.
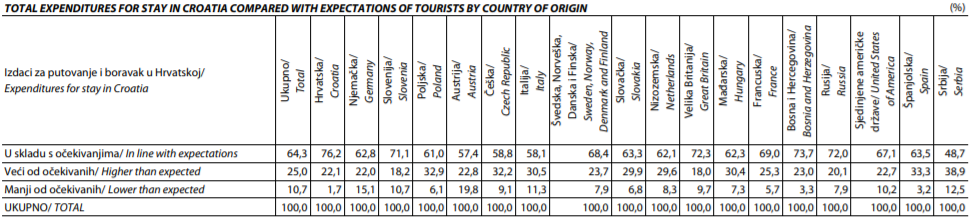
And one final and important finding for this article (there are many more in the full report) – feedback on the expenditures of their stay in Croatia. While all but one country reported more than half finding expenditures in line with expectations, in all cases a significantly larger proportion thought the costs were higher than expected than lower than expected.
Lots to take home and think about, positives and negatives – all of which can be turned to positives if we learn from the negatives and put them right.
To learn more about the work of the Institute for Tourism, visit the official website.
For the latest on Croatian tourism, follow the dedicated TCN travel section.